Dow 2007

Hi everyone,

Well the markets are zig zagging their way to nowhere in particular. This evening was hairy experience. Lost it and then recouped it back. Up +14 pips over two trades but the losses were relatively high at one point.

I'm short on DOW and long on cable at the mo.

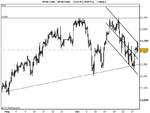
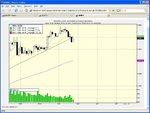
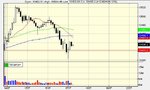
My favourite std err channel is telling me the DOW will turn down to 13200 levels all being equal.

Ofcourse the other side of the coin is a breach of 13480-13500 in which case std err channel is no longer in operation. However, it's usaully good for two three touches so I'm anticipating a down turn.

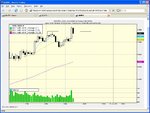
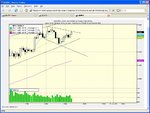
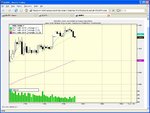
From last night I would say this is a significant breach of 13400 so the H&S is out the window for the time being. Still a posibility but for it to come into play I would expect a drop to 13200 and a bounce before a bigger down turn to 13000 levels. May take longer but it's still there as a possibility. This could be the dead cat bounce HS mentioned but I'm not sure how high a dead cat can bounce so I'm a little :rolleyes: ... :LOL:

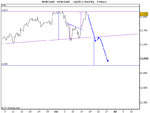
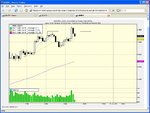
Just for a bit of an ego trip here is the original chart for good measure. The original date I have on it is the 15th of June for these predictions. ;)

I still have my spider senses tingling that this chart will materialise but I'm not sure if I'm reading the charts honestly or my vanity is playing dirty tricks with my mind. I suppose time will tell. :eek:


Good trading everyone.
 

Attachments

  • US30 Cash-070628.png
    US30 Cash-070628.png
    11 KB · Views: 135
  • US30 Cash3.png
    US30 Cash3.png
    7.8 KB · Views: 130
What a day! Excellent volatility to profit from. 3 trades to analyse all losers but hey, you win some you lose some. I must add that this is the most I have lost in one day since day trading the Dow (evenings) on 11th June 2007. The reasons for the losses, will become clear and I hope will be of benefit for you to comment on.

Chart 1 shows the first entry for the session. This was a late entry since the market had already moved off the swing low at the doji. I had got to my screen at 1730 and had not had time to fully digest the chart or prepare myself properly for an evenings session. Clearly this will now be incorporated into my trading plan. Chart 2 shows the manual exit for obvoius reasons: the inverted hammer on increased volume first caught my attention and once the price breached what was support at 13440, I was out! -17

Chart3 shows the second trade entry short. Like yesterday's post I waited for the price to breach 13440 'convincingly' and then wait for a pullback. Chart 4 shows the manual exit for this trade. What I failed to notice was the decreasing volume on the candle that breached 13440 'convincingly'. If there are other factors that I failed to recognise based on chart3 please let me know as all feedback is most welcome. Out for -17

Chart 5 shows the the final trade entry long based on the price breaching the day's high on massive volume. As before, waiting for the price to pullback to the previous high as indicated by the resistance line would be my moment of entry. A good entry point IMO since Chart7 shows the price action to the close. However, Chart 6 shows my exit which was due to a domestic event with what John Mortimer called She Who Must Be Obeyed. My attention and focus so thoroughly disrupted that I exited immediatly without hesitation. A good move since I am sure I would have held through to the bear candle at 1930 and been stopped out for a bigger loss. Out at -8.

In many ways I am disappointed that I could not see my position through the more choppier phases of the session to gain an insight into handlling these situations in the future more profitabably.

Lessons learned: Never enter a trade after the price has moved aaway from the swing low/high, pay much more attention to what volume is showing, liquidate positions when your focus/attention will be drawn away from the market. That, for me at least, is worth the -42 suffered today.

I hope this is of benefit to you. Comments are welcome as always.

Tafita
 

Attachments

  • chart5.JPG
    chart5.JPG
    109.6 KB · Views: 112
  • chart4.JPG
    chart4.JPG
    113.5 KB · Views: 101
  • chart3.JPG
    chart3.JPG
    111.1 KB · Views: 100
  • chart2.JPG
    chart2.JPG
    111.4 KB · Views: 114
  • chart1.JPG
    chart1.JPG
    107.6 KB · Views: 106
  • chart6.JPG
    chart6.JPG
    109.6 KB · Views: 104
  • chart7.JPG
    chart7.JPG
    123.4 KB · Views: 111
i had about 8 trades over last 2 days, net losses as 6 were losers.
came home today at 2pm entered a "paper'trade just for my own sanity (red arrow on image)
but had to go to bed as i've only had 2 hours sleep each of the last 2 nights (we are 12 hours ahead here so means i trade thru most of the night most nights).
needless to say my "paper" trade would have made 64 pips if I'd done it.
Sod's Law :eek:
 

Attachments

  • fri2906.gif
    fri2906.gif
    66 KB · Views: 128
i had about 8 trades over last 2 days, net losses as 6 were losers.
came home today at 2pm entered a "paper'trade just for my own sanity (red arrow on image)
but had to go to bed as i've only had 2 hours sleep each of the last 2 nights (we are 12 hours ahead here so means i trade thru most of the night most nights).
needless to say my "paper" trade would have made 64 pips if I'd done it.
Sod's Law :eek:

similar story here ..but sat on real a losing long all day .. held through the data at 1:30 (something I did not want to do) . as you know the markets rose .. so took my chance to get out for one point loss ,hoo bleeding ray!:mad:
 
Anyone see the current slide as a dip to be bought ?
I thought it would go up today - maybe its been up already !
 
Yes, I bought it near the low and panicked a cover for +1 net of spread for no reason (other than I wanted to see how you close a position in E*Trade).
 
Anyone see the current slide as a dip to be bought ?
I thought it would go up today - maybe its been up already !

looks like a short here -- why? lower volume - see chart
but then I am usually wrong
could rally later
 

Attachments

  • short maybe.jpg
    short maybe.jpg
    39.7 KB · Views: 110
Last edited:
Can't seem to see what is going to happen.
A bit steep to be a dip.
1/2 hr on the poker table beckons.
back later
 
Trade Management

Just a quick poser. I have read elsewhere on these boards that the best way to trade on days when announcements are due is to stay out of the market. Any thoughts on this?
 
Just a quick poser. I have read elsewhere on these boards that the best way to trade on days when announcements are due is to stay out of the market. Any thoughts on this?

i've heard and read that many times, but thought I knew better, thought I could scalp a few dollars here and there. It's been absolutely the worst week of my life.
I'm going to draw up a calendar with all future Fed announcements highlighted in red and take those weeks off, go play golf or something away from the damned screens.
Hopefully volume and trend will come back into the market next week; that's it for me for this week, have a good weekend all.
 
Net +9 for today with 5 E*Trade bets.

5 Trades
4 Wins
1 Loss
Average Win: 1.5
Average Loss: 8

See a pattern here - too much scalping and premature covers.

Up +9 net today, down £45 on the week.
 
Net +9 for today with 5 E*Trade bets.

5 Trades
4 Wins
1 Loss
Average Win: 1.5
Average Loss: 8

See a pattern here - too much scalping and premature covers.

Up +9 net today, down £45 on the week.


Up +47 today and still going strong...

Setting up a 30pip trailing stop now and will hold the free trade to see how far low it will go.

I seem to be performing better with day trading than intraday...

Up +60 now. This is fantastic. We could see 13280 soon.

Good luck everyone.
 
Up +47 today and still going strong...

Setting up a 30pip trailing stop now and will hold the free trade to see how far low it will go.

I seem to be performing better with day trading than intraday...

Up +60 now. This is fantastic. We could see 13280 soon.

Good luck everyone.

were you sitting on a big loss earlier? when the Dow was up?
 
Top