Adamus
Experienced member
- Messages
- 1,898
- Likes
- 97
Finally get something that's looks worth paper trading
Got to the point yesterday where I was getting seriously worried that I wasn't going to find anything useful. I think what I had been doing was not so much 'optimising', it would be better named 'pessimising' it. That's what it felt like. It always feels really bad to throw away a strategy/trading system, but I had to do it, it was dead in the water, floating upside down with a distended belly.
I spent a long time looking at candle stick patterns and I like the idea behind them so I tried different types both as a filter to prevent or trigger a trade, and as a trigger to ditch a trade, e.g. if I'm long and a bearish Harami pops up, exit at the mkt.
All of the stuff I played with didn't come to anything though. I'd focus on a particular chart and get the strategy to get me into or out of a trade perfectly during a particular little bit of price action.
Of course that kind of trigger didn't work a lot of the rest of the time.
The next thing I found after lots of tinkering actually appeared to come up trumps. I put a volatility filter on the buying and selling, just to stop it completely for periods at a time, and remarkably that did the trick.
I'd love to post my exact strategy here, but I'd also feel really uncomfortable doing it, I guess it's just my natural possessiveness - despite old Richard Dennis saying you can publish your system on a whole page advert in the Times and no-one will be able to use it properly. Actually I don't believe that's true these days.
So here's what I got from NinjaTrader's walk-forward process, from 1998 to end of March using 28 day periods optimize & walk-forward - this is the walk-forward totals on 8 pairs on 60 min bars.
And despite the huge amounts of processing that NinjaTrader did, there's still a lot I don't know:
- drawdown across all 8 pairs
- length of avg & max drawdown in days (both per pair and per basket)
- number of simultaneous trades in different pairs
- correlation of returns between pairs
all pretty important info for working out how much leverage to use and how much capital i need.
So what I need to do is extract the trade info from NinjaTrader - which I could do manually but that means something in the order of 5000 copy - paste operations. I should be able to do this by code.
In the meantime I guess I can run it on the paper trading account.
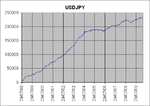
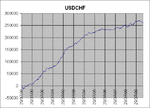
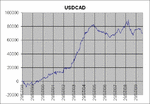
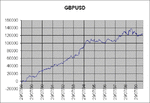
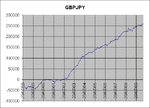
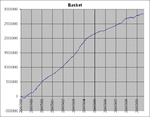
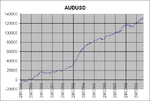
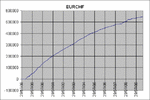
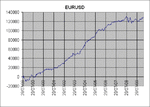
Here's some pretty graphs in lieu of stats like Sharpe Ratio and max profit / drawdown.
Got to the point yesterday where I was getting seriously worried that I wasn't going to find anything useful. I think what I had been doing was not so much 'optimising', it would be better named 'pessimising' it. That's what it felt like. It always feels really bad to throw away a strategy/trading system, but I had to do it, it was dead in the water, floating upside down with a distended belly.
I spent a long time looking at candle stick patterns and I like the idea behind them so I tried different types both as a filter to prevent or trigger a trade, and as a trigger to ditch a trade, e.g. if I'm long and a bearish Harami pops up, exit at the mkt.
All of the stuff I played with didn't come to anything though. I'd focus on a particular chart and get the strategy to get me into or out of a trade perfectly during a particular little bit of price action.
Of course that kind of trigger didn't work a lot of the rest of the time.
The next thing I found after lots of tinkering actually appeared to come up trumps. I put a volatility filter on the buying and selling, just to stop it completely for periods at a time, and remarkably that did the trick.
I'd love to post my exact strategy here, but I'd also feel really uncomfortable doing it, I guess it's just my natural possessiveness - despite old Richard Dennis saying you can publish your system on a whole page advert in the Times and no-one will be able to use it properly. Actually I don't believe that's true these days.
So here's what I got from NinjaTrader's walk-forward process, from 1998 to end of March using 28 day periods optimize & walk-forward - this is the walk-forward totals on 8 pairs on 60 min bars.
Code:
[FONT="Courier New"]Performance	All Trades
Total Net Profit		$1,753,529.58
Gross Profit			$10,229,250.26
Gross Loss				-$8,475,720.68
Commission				$564,733.00
Profit Factor			1.205
Max. Drawdown			-$1,534.23 (per mkt per month)
Total # of Trades		110175
Percent Profitable		47%
# of Winning Trades		51386
# of Losing Trades		58789
Average Trade			$15.92
Average Winning Trade	$199.25
Average Losing Trade	-$145.15
Ratio avg. Win / avg. Loss	1.39
Largest Winning Trade	$13,573.94
Largest Losing Trade	-$6,215.20
# of Trades per Day		25.68
Avg. Time in Mkt (mins)	183.85
Avg. Bars in Trade		2.35
Profit / Month / mkt	$1,435.74
[/FONT]
And despite the huge amounts of processing that NinjaTrader did, there's still a lot I don't know:
- drawdown across all 8 pairs
- length of avg & max drawdown in days (both per pair and per basket)
- number of simultaneous trades in different pairs
- correlation of returns between pairs
all pretty important info for working out how much leverage to use and how much capital i need.
So what I need to do is extract the trade info from NinjaTrader - which I could do manually but that means something in the order of 5000 copy - paste operations. I should be able to do this by code.
In the meantime I guess I can run it on the paper trading account.
Here's some pretty graphs in lieu of stats like Sharpe Ratio and max profit / drawdown.
Attachments
Last edited:

