Current Charts you find interesting

bbmac

Veteren member
Messages
3,584
Likes
789
Is € entering an uptrend against $ on Daily t/f ?

The strong recovery from the Daily LL at 2870 has seen an upside breech of the previous Daily descending trend line, that upside breech see-ing a H printed above the last LH and a pullback off that H to the topside of that descending trend line on the Daily t/f that acted as support for a further upside move to print a HH before encountering supply @ the previous Daily Swing Hi zone confluence with the 61.8% fib of the recent Daily/Weekly swing 4285- that 2870 swing low.

A master bearish engulfing candle resulted here on the Daily, this Friday's candle engulfing the previous 3 on that Daily t/f, resulting in a Weekly Doji being printed.

The 100sma remains above the 200sma on this Daily t/f and is currently pointing up.

The previous swing hi x 4 zone is below current price, housing the 38.2% of the 2870-3757 (Last Thursday's Hi ) Daily swing, with 61.8% of the last HL-HH (3243-3757) swing on this daily t/f, at the top of this potential rbs zone around around 3439.

How strong is this € upmove ? Is Friday's candle and the resulting Weekly candle ominous for the near-term bullish run ?

G/L

2a4tk6c.jpg
 
Last edited:
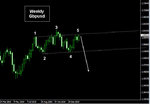
Lot of chatter at the moment on various sites as to whether this Weekly t/f (imperfect) H&S will play out on cable. The neckline of the right shoulder (point 4) did not breech the neck line of the left shoulder (point 2) and it is not fractally perfect-more a general H&S ?

So how may bears wanting the pattern to play out at point 5 ??

G/L
 

Attachments

  • z.jpg
    z.jpg
    45.7 KB · Views: 368
Last edited:
Lot of chatter at the meoment on various sites as to whether this Weekly t/f (imperfect) H&S will play out on cable. The neckline of the right shoulder (point 4) did not breech the neck line of the left shoulder (point 2) and it is not fractally perfect-more a general H&S ?

So how may bears wanting the pattern to play out at point 5 ??

In relation to the above, yesterday's candle was a master bullish thrust engulkfing, engulfing the bodies of the previous 2 daily candles and it breeched the descending trend line on that daily t/f. The follow thru today has also been bullish so far with price arriving at the previous 4hr/daily swing hi zone confluence with 76.4% 6297-5343.

G/L

28sc395.jpg
 
€ maintains it's bullish tone as price moves to a fresh high vs the $ today, 3842 as I write this...and above here and inbttween the previous Dly/Weekly swing hi zone leading up to 4285 are the 76.4% fib of said 4295-2870 with the 76.4% fib fan of that move being @ the current Daily Hi.

From the 2870 low the pairing has printed that as a LL then a H above it's last LH, then a HL, HH, and a HL, the current HH will be another HH when the fractal swing forms...this pairing is in an uptrend on this daily t/f

G/L

34gwuw9.jpg
 
hi everyone :)

this isnt about day types or market delta, but it is about the sp500 tomorrow and my take on it, so i thought id post it here so you can see and delete in after. home nobody minds :eek:

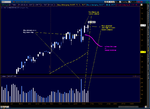
but you were talking about how you have a bias for the day, and i think these two graphs are interesting. its sort of market profiling / volume analysis. tho i dont trade ES cos I always lose money so remember that!!!!

anyway, ill get on with it.

if you look atthe first graph (the one zoomed really in close), it is an SPY daily chart. the writing on the graph says it all... there was a big down day with lots of volumes, and since then we have had 2 new highs on lower and lower volume.

Also, there is the gap up. If it was a breakout gap, you would expect to see some follow through / volumes on the upside.. but there arent any. the new high today was very weak if you were watching it, and most likely was a run on intraday shorts (you can see this on the other graph, the last 5 bars or so).

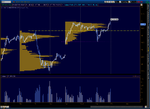
Now, the second graph is the SPY 15m graph with a 3 day volume profile on it in orange. So its the volumes of the last 3 days squished together.

A couple of points about this:

look at the volume profile - it is lopsided with most of the volume being done above the last high (the yellow line). But we know from the daily graph that the new highs that have been printed are on weaker volume. So what do I think? well, if most of the volume is being done near the top of the range, but the market cant convincingly continue higher, this is not a good sign that the trend is a strong one :cool:

as well, the last 3 days are pretty much just a channel. If the gap up was a "breakout" gap, you would like to see higher highs and higher lows as a continuation of the move. This makes me think that the gap might be an exhaustion one and fill to the downside like an "island day reversal" (i dont use candlesticks in my trading, and mostly always on daily graphs)

and the last thing, the push higher at the end of todays session to me looks like a squeeze on shorts from the sideways chop right on the yellow line before it. It also gives a nice double top and is a better place to short from than anywhere else.


anyway thats it, i thought id say it because its for the ES and i didnt know where else was best for you guys to see it. it is kind of market profile / volume trading as well. It all makes me think that the market will move more freely down than it will up, but obv. theirs NFP and that will dictate alot of the days action.

but you were saying about how you get ready for the next day, so heres my 2$c :) if anybody wants it out the way i will delete it cos i dont even trade this anyway :rolleyes:
 

Attachments

  • SPY_daily.png
    SPY_daily.png
    71 KB · Views: 481
  • SPY_15m.png
    SPY_15m.png
    41.3 KB · Views: 387
Very good stuff Dash. I shall keep this in mind tomorrow. The board needs more stuff like this.
 
Gbpusd

This previous 4hr/daily swinmg hi zone (previous resistance now support) has acted as support on 3 tests now...with Uk Boe/Mpc rate and Qe data due at 12noon gmt today, I wonder how much longer iut will continue to do so if tested...ie will no rate rise see some knee-jerk £ selling ?) Conversely any rate rise may see some knee-jerk £ strength? (Could be a surprise re MPC's 7-0-2 vote last time, as one other was persuaded by the Uber hawk Sentance ?)

Current neart-term 4hr is as below

G/L

wchd1f.jpg
 
Re 4hr gbpusd chart above, the concurrent previous daily swing hi zone is shown above, price has tested the extrene of that 4hr zone and found some demand.

2m64kyg.jpg


The concurrent 1hr previous swing lo zone is shown below.

28krbk5.jpg


Can this support contain any further downside ahead of the Boe/Mpc @ 12 noon ? Time will tell.

G/L
 
£'s recent strength has to some extent been built on the market's expectation that Boe will be first to raise rates...With last month see-ing a 7-0-2 split in the vote and with inflation continuing stubbornly high will the MPC act early or will they wait for the recovery to be a little more robust, (ie after 1st 1/4 Gdp # ?) Strange that they remain (officially at any rate,) only targeted on cpi inflation. Like all central banks they should aim to achieve a neutral - accomodative monetary policy, but I'm not sure that the official target reflects this aim.

Anyways, not strictly a 'current chart you find interesting' per thread title but relevant to the above charts that I did 'find interesting, (!')

G/L
 
Merv soon, RBA tonight.
 

Attachments

  • aud longer.gif
    aud longer.gif
    12.6 KB · Views: 360
  • aud shorter.gif
    aud shorter.gif
    11.5 KB · Views: 332
Few GBP crosses have had my interest for a while.

USD/ZAR: real neat and fairly predictable moves within a tight trend. Just a shame about the hideous spread (for me anyway).

EUR/AUD: A roughly two year continuous trend. Good example of how it pays to play weak Vs strong currencies.
 
Gbpusd, basis for move higher ??

A likely Doji / PB candle on the daily (not closed yet) today following the demand found at the confluence of the previous 4hr swing hi x 3 zone / previous daily swing hi zone / 100sma - 4hr / and 50% fib 5750-6277, the last significant daily swing up...4hr shown below.

4vn6s0.jpg


Tweezer bottom on the 1hr following a double test of that 6010 likely daily lo (thursday,)
Question is now, will the £ bulls use this as the basis as an attempt at that 6277 hi and above , despite the Boie/Mpc's decisons today?

G/L

r1hj0h.jpg
 
Re post #12 above, no follow thru higher off yesterday's close as price dips...4hr now in somewhat of a channel although yesterday's hi was a HH on this t/f. Will a 4hr HL result from the dip to today's current daily lo or will the market decide that there is no realistic chance of a near-term rate rise? (UK PPi numbers just out are well above forecasts adding to the mpc hawk's inflation argument ?)

G/L

mugd3.jpg
 
Few GBP crosses have had my interest for a while.

USD/ZAR: real neat and fairly predictable moves within a tight trend. Just a shame about the hideous spread (for me anyway).

EUR/AUD: A roughly two year continuous trend. Good example of how it pays to play weak Vs strong currencies.

Been looking at ZAR as well but as you say spread is pure evil.
 
re post # 13 (gbpusd)

1hr bearish thrust b/o of the recent 4hr congestion results in a current daily lo in the previous 4hr/daily swing hi zone...(potential rbs?) see 4hr picture below. In that potential rbs zone 5951-44 are 2 x unbreeched fibs ofthe major 4hr and daily swings up from 5343, as are 5928-20 lower down.

Looking pretty bearish now with this downside break of that 4hr channel/congestion and no follow thru from yesterday's HH on that t/f....

Ok, so who is going to fade that last 1hr candle ?

G/L

jl5ni1.jpg
 
Re: re post # 13 (gbpusd)

1hr bearish thrust b/o of the recent 4hr congestion results in a current daily lo in the previous 4hr/daily swing hi zone...(potential rbs?) see 4hr picture below. In that potential rbs zone 5951-44 are 2 x unbreeched fibs ofthe major 4hr and daily swings up from 5343, as are 5928-20 lower down.

Looking pretty bearish now with this downside break of that 4hr channel/congestion and no follow thru from yesterday's HH on that t/f....

Ok, so who is going to fade that last 1hr candle ?

G/L

jl5ni1.jpg

The charts attached are 4 hour and 1m GBP/USD respectively.

I trade Cable on a daily basis…..I trade off chart patterns and the wedge cable made in the 4 hour chart looks an excellent formation IMO.
It looks bearish for Cable now with no real support until 15900 IMO…what do you think?..

I trade off a 1min chart and im short Cable as we speak..with my entry price in the red box. I lost a few punts shorting it this morning but I have locked in a profit from the current trade and who knows how far it could go 

Are you short Cable at the moment?
 

Attachments

  • cable 1m.GIF
    cable 1m.GIF
    42.2 KB · Views: 252
  • cable 4h.GIF
    cable 4h.GIF
    29.3 KB · Views: 207
Re: re post # 13 (gbpusd)

The charts attached are 4 hour and 1m GBP/USD respectively.

I trade Cable on a daily basis…..I trade off chart patterns and the wedge cable made in the 4 hour chart looks an excellent formation IMO.
It looks bearish for Cable now with no real support until 15900 IMO…what do you think?..I trade off a 1min chart and im short Cable as we speak..with my entry price in the red box. I lost a few punts shorting it this morning but I have locked in a profit from the current trade and who knows how far it could go 

Are you short Cable at the moment?

Hi,

I have nothing specific in respect of potential support/rbs factors on 1hr + at 5900, that said it is a round No.

Nice short entry there in red box

I am flat atm, I was short on cable a couple of times on way down last being the 30min bearish thrust candle close @ 1030am being a b/o of previous lows..I went long at the bottom based a 1min regular bullish divergence based set-up with 5min + suporting set-ups (then unvalidated by a price action trigger) at that potential RBS zone discussed above, also the topside of the previous daily descending trend line came through there (joining 6297 with 6055 area.)

Doubtless there may be some sell the pullback/rally players in this last 1hr bearish thrust candle down to current lo. (I am sure using doubtless and may in the same sentance is a contradiction, lol )

G/L

G/L

oh1d2p.jpg
 
The daily chart shows that previous swing hi (ie previous res = potential supp) co-existant as same on 4hr with the previous descending trennd line.

Notice how I moved the trend line to fit exactly lol...well it was there or thereabouts depending on whether you connect highs or closes.G/L
 

Attachments

  • Z.jpg
    Z.jpg
    88.6 KB · Views: 205
Looks like the price is pulling back....It may pull all the way back to yesterdays low before the selling pressure continues

I have my stop for this trade above the red line...lets see how it pans out
 

Attachments

  • cable !.GIF
    cable !.GIF
    39 KB · Views: 238
nice formation on 1 min chart...if it breaks this wedge to the downside it looks like it could break sharply........if i did short term plays i would trade this for a few cheeky pips:cheesy:
 

Attachments

  • cable !.GIF
    cable !.GIF
    39.1 KB · Views: 208
Top