You are using an out of date browser. It may not display this or other websites correctly.
You should upgrade or use an alternative browser.
You should upgrade or use an alternative browser.
BLS
Established member
- Messages
- 642
- Likes
- 229
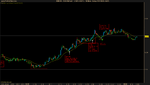
Missed a DD setup earlier because I was a bit distracted. I'm not sure I would have been comfortable taking a DD into the 50 level though. Volman says to be extremely careful when trading DD's around round numbers because those level can stop you out easily.
I skipped a BB under the 60 level because I wanted more build up. I'm a bit wary of trading BB's into even number levels (20, 40, 60, 80).
I did trade the DD when prices pulls back a couple pip inside that earlier BB. After prices printed a lower top I decided to move my stop up after that pullback to the 20EMA.
Attachments
samich1262
Well-known member
- Messages
- 293
- Likes
- 3
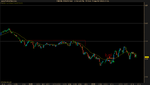
I really thought this RB looked good, but it didn't work out. 
Can't see anything obvious, but the bears definitely won this. I moved my tipping point up 1 pip which might not have been a good idea. Prices are still above the original tipping point now but they're really stalling, so I don't think this trade will take off anyways.
Can't see anything obvious, but the bears definitely won this. I moved my tipping point up 1 pip which might not have been a good idea. Prices are still above the original tipping point now but they're really stalling, so I don't think this trade will take off anyways.
stehlikpetrmsncom
Active member
- Messages
- 194
- Likes
- 3
Missed a DD setup earlier because I was a bit distracted. I'm not sure I would have been comfortable taking a DD into the 50 level though. Volman says to be extremely careful when trading DD's around round numbers because those level can stop you out easily.
I skipped a BB under the 60 level because I wanted more build up. I'm a bit wary of trading BB's into even number levels (20, 40, 60, 80).
I did trade the DD when prices pulls back a couple pip inside that earlier BB. After prices printed a lower top I decided to move my stop up after that pullback to the 20EMA.
Hi, I think you are mistaking "be careful" with "don't trade". Let's count pros and cons here, like Bob Volman often does in his book:
Pro
1/ Trending, momentum is with bulls, pullback is non-agressive and diagonal.
2/ Pullback holds at EMA.
3/ Pullback tests previous double top at number 40 (which is a significant level that paused the trend previously)
Con
1/ Number 50 ahead.
samich1262
Well-known member
- Messages
- 293
- Likes
- 3
I wondered about that first DD. Didn't take it because I thought the pullback was a little blocky, but I think it was ok in comparison to the uptrend. The 2nd one I skipped because it almost erased the entire uptrend, and while the downtrend was weaker than the uptrend, it was only weaker by a tiny bit. I thought the pressure was too even there to make it 10 pip. In comparison, that first DD trade's pullback was much less enthusiastic than the uptrend and it was nice and diagonal. I really contemplated that one but the blockiness led me to avoid it. It was probably a safe bet though.
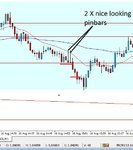
2 nice scalping opportunities on the Aussie 1 minute this morning:-
(I realise that these may not be Volman trades but I was just interested to see if there was any correlation - anyway I received the book yesterday. Quick skim yesterday. Not sold on tick charts I have to say...)
M
(I realise that these may not be Volman trades but I was just interested to see if there was any correlation - anyway I received the book yesterday. Quick skim yesterday. Not sold on tick charts I have to say...)
M
Attachments
stehlikpetrmsncom
Active member
- Messages
- 194
- Likes
- 3
2 nice scalping opportunities on the Aussie 1 minute this morning:-
(I realise that these may not be Volman trades but I was just interested to see if there was any correlation - anyway I received the book yesterday. Quick skim yesterday. Not sold on tick charts I have to say...)
M
Hi Mark, yes you utilise very similar strategy, however I'm sure you'll find useful information in the book that will perhaps lead to improvement and changes in your current method.
If you are not sold on tick charts, I suspect it may partially be because you like to use MetaTrader which doesn't offer tick charts. Don't discard it so quickly though. I suggest you read this little article which summarises the advantages of tick chart over time chart https://www.prorealtime.com/en/x-tick-charts
Hi mate,
I don't actually use MT4 to execute trades as it is a bit of a dog but it is the best for no nonsense charting for backtesting etc. My trading platform supports tick charts and I have researched these before (as well a lot of research on range bar charts).
Two reasons why I am not sold on ticks:
1) 70 is a fairly arbitary number vs say 1 minute charts which are likley to be used by many millions of users (albeit with marginally different closing times but nevertheless).
2) Price and time are adequate for me to tell when volatity has come into the market.
3) I don't know what the range of times for 70 ticks to complete during is but with a 1 minute chart I know that when I have done my analysis I only have to see maybe the last 10 seconds of that minute to know whether I will be placing a trade. I can learn a language in the other 50 seconds! With tick charts do you find yourself staring at the screen for the whole candle period?
By the way I am not against tick charts, I'm just saying that they don't provide me with any advantage over standard time based charts.
M
samich1262
Well-known member
- Messages
- 293
- Likes
- 3
Hi mate,
Two reasons why I am not sold on ticks:
1) 70 is a fairly arbitary number vs say 1 minute charts which are likley to be used by many millions of users (albeit with marginally different closing times but nevertheless).
2) Price and time are adequate for me to tell when volatity has come into the market.
3) I don't know what the range of times for 70 ticks to complete during is but with a 1 minute chart I know that when I have done my analysis I only have to see maybe the last 10 seconds of that minute to know whether I will be placing a trade. I can learn a language in the other 50 seconds! With tick charts do you find yourself staring at the screen for the whole candle period?
M
Hi Mark,
Just some thoughts on tick charts...
The 70 tick will still pretty much show the same formations as the 1 minute, but it will compress a little, cutting out long lapses where nothing is happening. Like, if there aren't hardly any trades going on for 10 minutes or so, this might look like a horizontal wall on a 1m chart, but really there's no significant pressure there.
My software prints the time every 10 bars at the bottom. It helps gauge if the market is moving fast or slow.
I initially felt the same way about tick charts at first. Volman talks about why "magic indicators" fail at one point in the book. He said in order for something to work everybody else has to be able to see it too, so I'm sure he wouldn't have picked a 70 tick chart if the patterns were that much different. However, if you like the 1m or a 30 second chart, stick with that, a lot of it's just preference. For me, on a slow day or afternoon session it is easier to spot formations on a tick chart.
My broker just started providing tick charts about 2 weeks ago (I don't use their charts though, I have separate software). It seems like they might be rising in popularity at least commercially. When I was researching software, it looks like tick charts are more common in pro software packages. Brokers might be more likely to use a chart like that than an average daytrader, and daytraders only make up 10% of market players.
stehlikpetrmsncom
Active member
- Messages
- 194
- Likes
- 3
Guys, let's talk learning. What are your methods to get better at trading besides from actual trading?
I really miss two things I can't do with prorealtime.com - I'd love to replay key sequences of the day and I'd also love to have some historical charts. Did you guys somehow solve these issues?
What good books would you recommend that go well with Volman's strategy?
I really miss two things I can't do with prorealtime.com - I'd love to replay key sequences of the day and I'd also love to have some historical charts. Did you guys somehow solve these issues?
What good books would you recommend that go well with Volman's strategy?
BLS
Established member
- Messages
- 642
- Likes
- 229
I'm not sure what you mean by replaying key sequences of the day. Do you mean having the ProRealTime go back to some specified time and then having it run it tick by tick? I don't think that's possible with ProRealTime but that would be awesome. I think you'll have to settle for manual back testing by scrolling the chart forward bar by bar. ProRealTime does have about 1 week's worth of historical tick data but you'll have to fork out more money for the premium service if you want more historical data.
samich1262
Well-known member
- Messages
- 293
- Likes
- 3

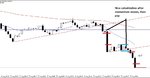
Just lost a DD. Anybody see anything particularly wrong with this trade? I thought the market was indeed trending at that point. Only things I can think of are:
1. Downtrend too vertical?
2. Didn't pull back to the 20 EMA but I didn't think that mattered since the pullback was 50%.
3. no retest of the previous range (at least not to the pip) but I didn't think that mattered since it had formed overhead resistance since then.
My DD accuracy is on and off. I go on streaks and haven't figured out what I'm doing wrong yet. If you see anything let me know!
BLS
Established member
- Messages
- 642
- Likes
- 229
View attachment 142952
Just lost a DD. Anybody see anything particularly wrong with this trade? I thought the market was indeed trending at that point. Only things I can think of are:
1. Downtrend too vertical?
2. Didn't pull back to the 20 EMA but I didn't think that mattered since the pullback was 50%.
3. no retest of the previous range (at least not to the pip) but I didn't think that mattered since it had formed overhead resistance since then.
My DD accuracy is on and off. I go on streaks and haven't figured out what I'm doing wrong yet. If you see anything let me know!
I think you traded too early. I waited for pullback to halt into previous support/40 level.
It's not that best looking pullback but we do have the overall pressure going to the downside and the pullback did test former support. I thought it was worth the risk to take this trade given the pros and cons.
Attachments
stehlikpetrmsncom
Active member
- Messages
- 194
- Likes
- 3
I'm not sure what you mean by replaying key sequences of the day. Do you mean having the ProRealTime go back to some specified time and then having it run it tick by tick? I don't think that's possible with ProRealTime but that would be awesome. I think you'll have to settle for manual back testing by scrolling the chart forward bar by bar. ProRealTime does have about 1 week's worth of historical tick data but you'll have to fork out more money for the premium service if you want more historical data.
With my previous strategy I used to replay trades on NinjaTrader. If you missed a trade you could simply press Play and enter, manage and exit the trade as if it were live sessions. An excellet tool for training!
Regarding the historical data, ProRealTime offers about 2 months with Premium version for 70-tick chart - the less ticks you use, the less data you get. I tried with trial version. But I want 2 years of 70-tick charts! 🙂
samich1262
Well-known member
- Messages
- 293
- Likes
- 3
Guys, let's talk learning. What are your methods to get better at trading besides from actual trading?
I really miss two things I can't do with prorealtime.com - I'd love to replay key sequences of the day and I'd also love to have some historical charts. Did you guys somehow solve these issues?
What good books would you recommend that go well with Volman's strategy?
I usually scroll back through the week's charts 1 bar at a time and paper-trade at the end of the week. Sometimes I'll pick another pair like AUD/USD too just to get some extra practice looking at charts. I am not sure of any other books would work well. I read 4 or 5 books before I found Volman's, but none of them were as in-depth. They were mostly trading by scaling into positions or swing trading. I couldn't find any other effective scalping book, but I think there's more than enough info in Volman's book to learn to trade well. Some other books I read mentioned scalping but never actually explained it in detail. I'm sure there's more out there but the strategies that I read about varied so much that I didn't want to learn too many until I had mastered one.
stehlikpetrmsncom
Active member
- Messages
- 194
- Likes
- 3
samich1262:
Hi, there's nothing really wrong with that setup (although the pullback could look better). If a trade fails it does not necessarily mean there was something wrong. I traded this setup as well, got kicked out. Reason? If you scroll a day or two back, there is a support.
Hi, there's nothing really wrong with that setup (although the pullback could look better). If a trade fails it does not necessarily mean there was something wrong. I traded this setup as well, got kicked out. Reason? If you scroll a day or two back, there is a support.
samich1262
Well-known member
- Messages
- 293
- Likes
- 3
I think you traded too early. I waited for pullback to halt into previous support/40 level.
It's not that best looking pullback but we do have the overall pressure going to the downside and the pullback did test former support. I thought it was worth the risk to take this trade given the pros and cons.
I did think about that, a retest of the 40 level would have been ideal. At the time, I didn't think it would be absolutely necessary, but maybe it was since the downtrend was only 2 bars. If it hadn't made those blocky dojis, I would have taken the trade at the 40 level, but that section scared me off from getting back in.
BLS
Established member
- Messages
- 642
- Likes
- 229
With my previous strategy I used to replay trades on NinjaTrader. If you missed a trade you could simply press Play and enter, manage and exit the trade as if it were live sessions. An excellet tool for training!
Regarding the historical data, ProRealTime offers about 2 months with Premium version for 70-tick chart - the less ticks you use, the less data you get. I tried with trial version. But I want 2 years of 70-tick charts! 🙂
That's a lot of bars 😱.
If you can find a reliable (demo) tick feed, you might be able to use Ninja Trader for that same feature? Or is that feature only available with the paid version of NinjaTrader? I'm not sure because I haven't used Ninja Trader but you might want to take a look at a demo account with MB Trading. I think someone here used the MB Trading demo feed with NinjaTrader but the "live" feed wasn't reliable. The historical data should be more reliable though.
BLS
Established member
- Messages
- 642
- Likes
- 229
As for other trading books, I've been reading "The Daily Trading Coach - 101 Lessons for becoming your own trading psychologist", albeit slowly. I found it helpful in keeping track and trying to manage my progress with Volman's method. Not all of the principles/techniques will apply to the scalping method but I think it's a useful read nonetheless (at least the first two chapters that I have read so far anyway).
I tried reading Trading in the Zone but found it difficult to get through the author's verbose writing.
I tried reading Trading in the Zone but found it difficult to get through the author's verbose writing.
samich1262
Well-known member
- Messages
- 293
- Likes
- 3
samich1262:
Hi, there's nothing really wrong with that setup (although the pullback could look better). If a trade fails it does not necessarily mean there was something wrong. I traded this setup as well, got kicked out. Reason? If you scroll a day or two back, there is a support.
Thanks. When you say the pullback could look better, did you mean you would have preferred it to pull back a little more? Or retest previous support first? Just wondering.
Similar threads
- Replies
- 15
- Views
- 8K