BLS
Established member
- Messages
- 642
- Likes
- 229
...and another....
I think I got into the same trade that you did but I was aiming for 10 pip.
Attachments

Last edited:
...and another....
Did anyone else take this Range Break setup on EURUSD?
I ended up with a loss of 3.3 pips but I'm fairly happy with the trade. It seemed to be a valid setup and I managed it well enough.


Hmm, I've been saying that I need to reduce my trade volume because I'm hesitant to get into valid setups. I think after today, I definitely will. I got up at 4:30 central time to catch part of the European session since it has been moving better than the US session this week. I saw two perfect BB's and skipped them. It really doesn't get any better than this, so I think trade volume is the reason for my hesitation. BB's were one of the last setups that I became comfortable with. I am still not comfortable with IRB's although I have seen 2 today. All in all, it's a much better trading opportunity day than Monday and Tuesday.
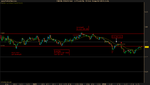
EUR/USD European session chart:
View attachment 142772
Here's an RB that I skipped. It had plenty of pressure and I probably should have taken it, but I didn't like that to the left there were some lower lows. Still, there was a pretty good buildup before the break. 9 equal touches to the barrier before the break, I think that makes this a valid RB that should have been taken. But I have not yet gotten comfortable with setups that don't have extremely economical stops, and I think that was my main reason for hesitation. The risk here was about 6 pips.
After that, there's a great BB that I didn't take, probably because of that FB in the middle of it, but there were 8 equal touches of that low plus several dojis. I am kicking myself for this one.
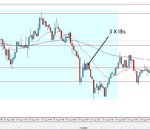
Then I saw a nearly identical BB during the US session on the AUD/USD chart:
View attachment 142774
Missed this one too. I hate setups that come after IRBs or that don't have a retest, but this one looked like it had proper buildup to me. The stop was pretty economical. That 2nd box on the AUD/USD chart didn't have a good push so I skipped it. I did not think there was enough pressure to break the round number zone. It's ranging right now below the round number.
I think I am going to have to reduce my trading volume to .2 or .3 lots until I can become more logical. Part of it is not trusting my judgement yet, but that will come with experience.
AUD/USD is becoming my 2nd favorite pair. It seems to move enough and has some high quality setups. It behaves similar to the EUR/USD in terms of movement and smoothness. USD/CAD is too slow, and GBP/USD is good sometimes, but it's wild and choppy at other times. I always watch EUR/USD first but if it slows down, I scan the AUD/USD and GBP/USD charts to see if there's anything trade-able there. At the very least, watching them will help me learn to identify valid setups quicker.
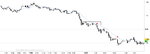
Well, lowering my trade volume helped. I missed this RB and decided to lower it after missing my 4th valid setup of the day. Lol. I was then able to get in on the BB here on the AUD/USD chart. I did exit for about a 4 pip gain after it dipped below that line. I felt like if price came down and attempted to go back up, that horizontal wall of price action would be tough to crack. This pair made a nice run this morning. EUR/USD made a nice run during the European session but has been consolidating all morning. My goal will be to get comfortable and work my lot size back up to .5 by the end of the month, and then work my way up to 1 full lot sometime in September.
View attachment 142786
PS - Ignore the thumbnail chart. I don't know how that old chart got attached as a thumbnail. Oops. Haha.
The first RB in EURUSD isn't valid in my opinion. It just isn't a well defined range. There are lower lows at 03:00 which would put me off and the breakout level was only touched once prior to the break.
The BB in EURUSD is better, I was watching this at the time but I didn't take it because of the false break midway through the block. I can see how a more aggressive scalper would have taken this though.
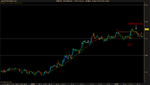
This RB got pretty damn close to target but I didn't want to make a habit of closing out early for no technical reason. Still, I'm kicking myself a bit.
Prices made a false break to the downside after the bulls failed to break to the upside earlier. We get a pullback to the 20EMA where a bunch of dojis formed. I would have likes to see prices test the 80 again and make a series of lower arches before a break but I thought those dojis represented a lot of tension. There was a lot of uncertainty here and the bears emerged victorious. Prices went down 9 pip in my favor before stagnating. I place my new tipping point at the previous false break level because prices couldn't follow through and it seemed like a very technical place for a stop, even though it was one pip below the 20EMA. My stop does seem a bit aggressive but after that second bottom you'd probably bail 1 pip above my stop (if you haven't bailed when prices reached that second bottom 😛).
I'm a bit frustrated that my valid trades haven't worked out too well but at the same time I'm glad that I didn't take any obviously bad trades today. That's some progress for me. I'm finding my patience again.
I just have to remind myself that I don't have to make money today to have a good trading day. I just have to follow sound trading practices, from skilled execution to prudent risk management.
 I'm not very good at IRB's/ARBs yet.
I skipped this because of that price action to the left. Although, the setup did come after basically a triple bottom followed by a double bottom with a higher low. What do you guys think? Too risky? Or do overall conditions provide enough support? View attachment 142800I'm not very good at IRB's/ARBs yet.
Just look at the chart, would prices break from that rectangle (and you were in a trade), there is MUCH more chart resistance to the downside than to the upside. Path of least resistance is clearly to the upside and even though there will definitely be some selling at the high point, the rectangle will provide a SOLID support where more buyers will come to help your trade.I skipped this because of that price action to the left. Although, the setup did come after basically a triple bottom followed by a double bottom with a higher low. What do you guys think? Too risky? Or do overall conditions provide enough support? View attachment 142800I'm not very good at IRB's/ARBs yet.