So I've been checking the economic calendar and occasionally watching the AUD/USD when there are announcements with a high volatility rating coming. So at 8:30pm my time, it trends nicely for an hour or so once or twice a week. The last time I watched it, it had even better setups, but this isn't bad either. I have just been observing so I can see how fast I should expect it to move, but I think I may start taking these. I know the Asian session doesn't have a lot of activity, but this honestly has looked easier than the EUR/USD on some mornings in the past week. The news announcements sometimes give it just the push it needs to start trending.
View attachment 143138
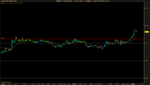
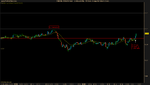
The first arrow is a valid Doji. It tests the previous range to the pip, is much more compressed than the upward move, and the two dojis even have an even low. Can't get a much clearer setup than that.
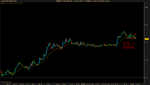
The second one looked like an SB to me. Right in the 20 EMA, using a previous pullback as support.
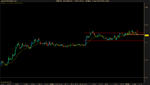
The third one was the least attractive setup, but the pullback is a little weaker than the trend. It's got some compressed dojis, is relatively diagonal and the signal bar pierces the 20 EMA. The two negatives here are the pullback was a little long, and it erased 90% of the previous move. Plus the trend was weakening at that point. It's currently still 2-3 pips above the entry bar and is forming a small BB setup, but things have slowed down. I would probably skip the DD setup since it looked like momentum was slowing down at that point.
Anyways, I know not everybody likes the AUD/USD pair, but under the right conditions, it acts very closely like the EUR/USD. My spread ranges from 0.6-1.0, so it's worth it for me. The only other night this week with significant news for this pair is Thursday. If there's no major news for a pair during the Asian session, I don't even check it. But tonight could have given a couple nice wins in about 45 min.