Price Action Scalping

Thanks for the feedback, especially about the big round number. As I reread Bob's book and assemble some notes I keep picking up information that I overlooked on my first read (like avoiding BRN areas except when prices are trending nicely). I'll need to continue trading light, which one can do with Forex, but it certainly helps to do some trading. But for now I need a bit more in the "quality of my education" department.

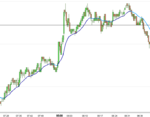
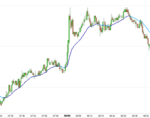
The market should be able to be traded with this method on all time/tick scales. Bob did the work finding the appropriate ema for the 70 tick chart, and looks like Alexander Elders factor of five leads to the same choice of the 20 ema on the 350 tick chart as well. I haven't done a careful side by side comparison but the 350 tick looks similar to the 5 minute chart that Al Brooks uses. Just a quick look at the two charts and you can see that the tick chart hides the information you do not want (endless low volume bars that go nowhere) and shows information that you want (buyer/seller volume coming in on spikes).

Later,
Chart

Chart

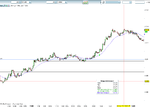
I also think you got in a middle of a fighting cat (1.31), you need to constantly remember that as a retailer you do not have the luxury to get into the fight, wait and enter only once one of the part lets go of the rope, that is our edge.

You need to have a clear mind to do that and that is why is better not to trade if the chances are not there. Yes, many times we will miss trades, but also means that we are building stronger patience.

Also I did not see any reasons to why you have to scratch the trade, the technical side of it was indicating otherwise. (Fear)

As you can see from the chart there could have be other possibility to enter once the bulls took control.

Screen time will make the difference (backed by passion and tenacity), I suggest the you stick to only one timeframe, so you can became very familiar with it, what works after the fact in a different environment is just an illusion.


Mike
 

Attachments

  • 2.png
    2.png
    24.9 KB · Views: 504
Last edited:
Chart

I also think you got in a middle of a fighting cat (1.31), you need to constantly remember that as a retailer you do not have the luxury to get into the fight, wait and enter only once one of the part lets go of the rope, that is our edge.

You need to have a clear mind to do that and that is why is better not to trade if the chances are not there.

Also I did not see any reasons to why you have to scratch the trade, the technical side of it was indicating otherwise. (Fear)

As you can see from the chart there could have be other possibility to enter once the bulls took control.

Screen time will make the difference (backed by passion and tenacity), I suggest the you stick to only one timeframe, so you can became very familiar with it, what works after the fact in a different environment is just an illusion.


Mike

I agree on all points (the extra time frame is a distraction). Also I agree and add maybe just for self reinforcement, that the battles around the BRN, can take place many pip above and below the number. They don't let go of the rope until 3.109.

That would have been a great entry.

Thanks again for your advice.

Chart

Chart

You know you are very welcome.

I think if we try and be very selective it will be good to build up the confidence, once the confidence kicks in, then we may add some more creativity also.

We need to try to pocket one trade a day, even half (you know what I mean), as you know we risk 2% per trade (once we know what we are doing) on a target of 10 pips, pocketing 5 pips a day makes us 1%. If we make 5 pips average a day for about a month, then we also have the confidence to take our volume up.

Mike
 
Fox

LOL, I got in where you got out, anyway seems that the candles are slightly different, are you using the 70 tick one?

To me the overall picture was down, so I was looking to short, just below the 1.31 number she start to make lower highs that ended in some kind of head and shoulder pattern, at the break of the barrier I was in.

thanks for pointing this out. Looking again at the 70 tick chart I cannot find my trade, so obviously I was using something different. I was playing around the charts and working my ordinary job at the same time and I screwed up chart config - this is not good :(
And yeah, my trade was pretty agressive, usually I do not trade against the trend. I took also because it was approaching 1.31 and was counting on Vacuum suck .

I am not saying that my way was the right way, I think yours was a good trade, higher bottom were forming and the direction definitely change to the upside afterwards.

In my case I was able to make money based on the fact that at that time the overall trend was down, she slowed down and formed that head and shoulder pattern at 38 % retracement of the prior trend, that is were I got interested.

There was a clear battle there, once the price closed below the barrier I was in.
The profit was made quick as a consequence of the double pressure, but I got my profit just in time because the trend as you were able to defined in your trade, soon was picked by the convinced bulls that end up in the trade that Chart took.

Mike
 
Here was a case where the trade of the BRN was a good choice. The PA was still moving quite a bit above and below the 20ema, but I guess the higher lows and equal highs should have given it away. I didn't take the trade.

Also the bears must have seen it coming (I interpretet the large bar as a low volume move with almost no participation by the bears, only bulls lifting the offer). But no follow through after that. Why? Could the low tick volume and no follow through be related or is their some other explanation?

Chart
 

Attachments

  • eur-usd-4-20-12-0800-1035-pop-through-BRN.PNG
    eur-usd-4-20-12-0800-1035-pop-through-BRN.PNG
    38 KB · Views: 460
I'm finding the oanda 30s timeframe mimics the 70 tick pretty well. Would you all agree? Not sure how much this 1.2 spread is eating into profits yet though. Don't have enough data.

The market should be able to be traded with this method on all time/tick scales. Bob did the work finding the appropriate ema for the 70 tick chart, and looks like Alexander Elders factor of five leads to the same choice of the 20 ema on the 350 tick chart as well. I haven't done a careful side by side comparison but the 350 tick looks similar to the 5 minute chart that Al Brooks uses. Just a quick look at the two charts and you can see that the tick chart hides the information you do not want (endless low volume bars that go nowhere) and shows information that you want (buyer/seller volume coming in on spikes).

Later,
Chart
 
I'm finding the oanda 30s timeframe mimics the 70 tick pretty well. Would you all agree? Not sure how much this 1.2 spread is eating into profits yet though. Don't have enough data.

I agree it is close and is a worthwile discussion. Every once in a while I find the time scale based charts hide sideways motion during strong upward moves. On tick frame based charts this sideward motion moves the PA rightward towards the 20 ema. This is important in the case of a DD setup. In the charts below the DD setup showed up at 8:06GMT on the 70 tick chart (left) but did not on the 30 second chart (right).

I guess I think this helps me in my current training mode, and if I were trading one standard lot that one trade would easily cover the ~$50/month I pay for the tick data.

Chart
 

Attachments

  • eur-usd-4-20-12-0730-840GMT-70T-DD.PNG
    eur-usd-4-20-12-0730-840GMT-70T-DD.PNG
    17.8 KB · Views: 419
  • eur-usd-4-20-12-0730-840GMT-30s-DD.PNG
    eur-usd-4-20-12-0730-840GMT-30s-DD.PNG
    18.3 KB · Views: 385
Took one trade this evening. Note that I did not take the BB trade at 2. The trade (red arrow after 5) was taken because the attempt by the bulls at 4 was feeble and set up the possibility for lower highs. The support at 1 combined with 5 touches of the signal line looked like it might have built up enough tension to break through the 1.32 level which it fortunately did.

Chart
 

Attachments

  • eur-usd-4-22-12-1600-2000-BB.PNG
    eur-usd-4-22-12-1600-2000-BB.PNG
    20 KB · Views: 453
Took one trade this evening. Note that I did not take the BB trade at 2. The trade (red arrow after 5) was taken because the attempt by the bulls at 4 was feeble and set up the possibility for lower highs. The support at 1 combined with 5 touches of the signal line looked like it might have built up enough tension to break through the 1.32 level which it fortunately did.

Chart

Nice one.
Regarding 1.32: did you move SL to BE after the touch of it? I mean, you never know what happens after so important line is touched..
 
Nice one.
Regarding 1.32: did you move SL to BE after the touch of it? I mean, you never know what happens after so important line is touched..

Thanks Fox. Thats a really good question. I did in fact move my SL to BE. According to Bob I was not supposed to do that (p.247) since it was not a technical level so during the trade I was fighting the urge but gave in. But then the chart gave me two technical opportunities to lower the stop during the trade. Being the first trade of the week I was worried about beginning the week with a losing trade (certainly a common misconception) so that was effecting me as well, obviously evidence that I am still not thinking in probabilities (there are good discussions on on p.95, p.122).

I was looking back at the chart and noticed that some of the data had changed from when I took the trade, actually making the two trades discussed in my previous post look less appealing.

Chart

I got the same problems. Not looking on bigger timeframe, wanting not to lose a single trade. And I am also moving SL in cases like this. According to Bob we either take the trade or if we are uncomfortable with it we don't. But for me I feel (at the moment) much more relaxed taking the trade and moving SL to BE.
Here is my first one for today, range break, TP 8 pips, SL 5 pips. A little risky but beacuse overall slightly pointing up and geting small SL I took a bite.
I hope there will be some more, missing trading after short vacation :)
 

Attachments

  • scalpx16-win9pips.PNG
    scalpx16-win9pips.PNG
    19.2 KB · Views: 402
I got the same problems. Not looking on bigger timeframe, wanting not to lose a single trade. And I am also moving SL in cases like this. According to Bob we either take the trade or if we are uncomfortable with it we don't. But for me I feel (at the moment) much more relaxed taking the trade and moving SL to BE.
Here is my first one for today, range break, TP 8 pips, SL 5 pips. A little risky but beacuse overall slightly pointing up and geting small SL I took a bite.
I hope there will be some more, missing trading after short vacation :)

Nice trade! I agree with the assessment, that the market was moving up. I watched the PA and let that trade go since I could not see the prebreakout tension. I actually had my signal line 1 pip lower but in retrospect your line was better (even vindicated by the backtest) since it allowed you to see more buildup before the entry. Maybe the important thing was there was a long coiling time so it was likely to travel quite a distance, and at least to your TP, if it went your way.

I have a lot of bad habits, one that comes to mind is that of looking at the trading platform, and P&L. I might not hear the "proverbial click" but may have to work on each problem one at a time.
 
Good evening gents.
Not much time today and since EURUSD is almost dead this time I went to check other pair - AUDUSD. Not much better but after 10 minutes of watching I spotted a long channel about to get broken - higher highs, higher lows. Did not want to enter the trade after the first break and it really was a tease. Few minutes later after 2 dojis formed and EMA squeeze I just had to go in after break. Because the movement was slow I decided that the max TP I would go for is 8 pips and set SL at 5 pips.
Second trade with real money and successful.
What pairs are good for this method in asian session? Anyone doing non-EURUSD?
 

Attachments

  • scalp18-win8pips.PNG
    scalp18-win8pips.PNG
    27.5 KB · Views: 580
Last edited:
one scratch today.
News related quick rise I believe, was looking for reversal, got in after block (well not the perfect one I admit) broken and 2 dojis formed. TP was set to 9 pips, got to 8 and then reversed. I was not watching the trade otherwise I would close it for 8. Moved the SL to BE so just a scratch. After reversal it went down again. Ehh, moving on...
 

Attachments

  • trade18-scratch.PNG
    trade18-scratch.PNG
    26.5 KB · Views: 448
Last edited:
2nd trade today:
similar setup as previous trade only the setup looking a little bit nicer. SL 6 pips and TP 9 pips reached in couple of minutes. Notice how the magnet of 1.32 pulled the price down?
If I did not mention already: I am trading mainly on Bob Volman's book 'Price action Scalping' on 70 ticks time-frame on EURUSD pair (if not stated otherwise) with GMT timescale.
cheers, fox
 

Attachments

  • trade19-9pip-win.PNG
    trade19-9pip-win.PNG
    23.7 KB · Views: 549
I personally don't trade the asian session at all it's typically so dead (for the EUR/USD) I tend to focus on London Open and New York Open.

What about you guys?

Good evening gents.
Not much time today and since EURUSD is almost dead this time I went to check other pair - AUDUSD. Not much better but after 10 minutes of watching I spotted a long channel about to get broken - higher highs, higher lows. Did not want to enter the trade after the first break and it really was a tease. Few minutes later after 2 dojis formed and EMA squeeze I just had to go in after break. Because the movement was slow I decided that the max TP I would go for is 8 pips and set SL at 5 pips.
Second trade with real money and successful.
What pairs are good for this method in asian session? Anyone doing non-EURUSD?
 
I personally don't trade the asian session at all it's typically so dead (for the EUR/USD) I tend to focus on London Open and New York Open.

What about you guys?

I only trade the EUR/USD, at least lately.

I start trading a few hours into the London session, then trade the overlap period between London and New York. The end of the New York session can get pretty dull but I will trade it sometimes. I agree that the Asian session is usually slow but it has been good at the beginning of the week, Sunday going into Monday.

Chart
 
so we all have similar trading schedule :)
cannot complain because I live in Europe and it fits my 'sitting-on-front-of-the-computer' schedule ..
another trade today:
after a quick rise the price slowly moving down forming nice lower highs. The break was not the cleanest, would prefer the dojis to appear one pip lower but because otherwise nice setup I sell at the break (SL=6 pips, TP=8). I believe I did not manage the trade well afterwards. I should probably close it before or let it run to full TP ( I exited at 6.5 pips profit, half minute before it went down and breaking TP level). Again I was impatient with the trade. I think that looking at being red for the most part of the trade took its toll. Gotta learn how to handle these situations.
Looking back at the chart a few more trades were possible today but again I was not at the computer...
 

Attachments

  • trade20-WIN-6pips.PNG
    trade20-WIN-6pips.PNG
    27.4 KB · Views: 733
Is anyone interested in continuing this thread here or elsewhere?

I certainly got a lot out of Mike's and others analysis.

-Matt
 
Top