You are using an out of date browser. It may not display this or other websites correctly.
You should upgrade or use an alternative browser.
You should upgrade or use an alternative browser.
Futures Rise on Banks Enthusiasm - Market Overview * US * News * Story - MSNBC.com
higher open due to large sell orders?
Glen
spoke abit soon?
Financials Lead Rally to Kick Off Q2 - Market Overview * US * News * Story - MSNBC.com
Both of Grey1's posts 551 and 556 recently are encouraging and informative. They show that we are all in the same boat, when trying to determine market direction and to apply the various strategies over different timescales.
This is important because it shows that we are not necessarily failing to understand the strategies - rather, it is a tricky market at present and it pays to be cautious, only trading when clear signals are provided.
Thank you Iraj - I think we all needed some encouragement and a degree of comfort that we were not going bonkers :cheesy:
Charlton
Running total (of non trades)
= $2,459
just keeping on eye on them
Market looks like it may test bottom?
Glen
these babies would have been stuffed tonight
=-$202
I guess Grey was correct regarding swings (with volitility as it is at the mo)_
Attachments
very interesting interview
MSNBC - Video Front Page
funny how Grey1 was saying all the same stuff months ago.
anyone seen the both of them in the same room, at the same time🙂
MSNBC - Video Front Page
funny how Grey1 was saying all the same stuff months ago.
anyone seen the both of them in the same room, at the same time🙂
Last edited:
no trades, as Grey1 says
but I'll keep an eye on these top 14 weak stocks over the next few days/ weeks
indu macci day o/b at present =104 & at previous turn level
Glen
these trades would be actually back in profit now, however i would probably have exited a few days ago when the macci indu daily turn up from about -60 level. (loss would have been just over $1,000)
both sides of the Citigroup story
At Citigroup, A Big Loss is Only Part of The Story - Earnings * US * News * Story - MSNBC.com
who do you listen to?
Hugh Hendry Fund Manager Factsheet | Professional Investor | Citywire
Or
Robert Olstein Stock Holdings, Investment Philosophies and News -- GuruFocus.com
or make your own mind up?
At Citigroup, A Big Loss is Only Part of The Story - Earnings * US * News * Story - MSNBC.com
who do you listen to?
Hugh Hendry Fund Manager Factsheet | Professional Investor | Citywire
Or
Robert Olstein Stock Holdings, Investment Philosophies and News -- GuruFocus.com
or make your own mind up?
brutusdog
Guest
- Messages
- 759
- Likes
- 194
I guess GE is one of those companies that can move a market $374B market cap
yes but that was a news trigger to a technical situation. (12750 as strong over head resistance) news like that will not put such a big dent in a stronger market.
imo the market was poised on the brink after struggling to keep its gains for the past few days and not getting any higher then it only takes something like that to tip it over the edge.
Glenn
Experienced member
- Messages
- 1,040
- Likes
- 118
So where is all the money going ?
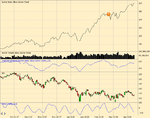
Can't trade much this week due to doing voluntary work. However found time to review what is happening within the market by looking at the main Sectors.
See attached pic and compare with INDU.
BM, UT, EN (last 2 chars of symbol) are holding up well - Basic Materials, Energy and Utilities.
What does that say ? If you've been listening to CNBC you will know.
All the rest are looking weak and currently OS on Macci. Their Macci's since March are very similar in shape too, and also the same as the INDU Macci.
Question is whether they are going to stay weak, with maybe a small bounce, or reverse up?
BM, UT, EN look as if they have more to go yet because they are consolidating near highs and Macci's look strong.
Helps to know where to look for likely swing trades and which side of the market to be on for Daytrades imho.
Glenn
Attachments
What does that say ? If you've been listening to CNBC you will know.
hmmm, Oil prices high? other actual 'stuff' prices high? the money that left the finacial sector now entering else where? (at a guess?)
glen
Small to mid cap oil stocks, ag chem, other resources.
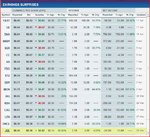
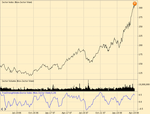
Attached a unweighted index of 14 screened using some of the techniques on the momentum thread I started, and then filtered by eyballing the charts. Nearly all are resource stocks.
CHDX, KWR, SAFM, XIDE, CWEI, GEOI, JRCC, PQ, SCL, BDE, BRY, CRZO, KEX, MCF
Attached a unweighted index of 14 screened using some of the techniques on the momentum thread I started, and then filtered by eyballing the charts. Nearly all are resource stocks.
CHDX, KWR, SAFM, XIDE, CWEI, GEOI, JRCC, PQ, SCL, BDE, BRY, CRZO, KEX, MCF
Attachments
Small to mid cap oil stocks, ag chem, other resources.
Attached a unweighted index of 14 screened using some of the techniques on the momentum thread I started, and then filtered by eyballing the charts. Nearly all are resource stocks.
CHDX, KWR, SAFM, XIDE, CWEI, GEOI, JRCC, PQ, SCL, BDE, BRY, CRZO, KEX, MCF
hi dc,
is there an edge to be had here. do you think oil stocks lag oil prices or vice visa, or is it too hard too say
cheers
Glen
hi dc,
is there an edge to be had here. do you think oil stocks lag oil prices or vice visa, or is it too hard too say
cheers
Glen
I dunno, and sometimes I think that dumb might be better - just follow what the market is doing. Obviously that lot is too concentrated in one sector/industry for comfort.
Here is the result of similiar screens on 6th March that I hand picked stocks from to form a portfolio of 30 stocks for a forward test. Not bad really as I only spent 5 mins eyeballing the charts. Beats s&P by mile. a lot of resource stocks in that lot too, but I did not screen on market cap in that case.
Attachments
I dunno, and sometimes I think that dumb might be better - just follow what the market is doing. Obviously that lot is too concentrated in one sector/industry for comfort.
Here is the result of similiar screens on 6th March that I hand picked stocks from to form a portfolio of 30 stocks for a forward test. Not bad really as I only spent 5 mins eyeballing the charts. Beats s&P by mile. a lot of resource stocks in that lot too, but I did not screen on market cap in that case.
hi dc,
how do you pick these stocks out, are you just looking a their charts in relation to the market chart, and if its rising quicker that the market over a period, its a strong stock? (or do you take into consideration the volatility of the stocks and market as well? via ATR maybe?)
sorry for the silly questions
belflan
See this thread:
http://www.trade2win.com/boards/technical-trader/29358-momentum-relative-strength.html
I'm using my own screener that I wrote and then eyeballing the charts for obvious reasons to reject a stock. There seems to still be an edge without human intervention. Essential part of the screen is "relative strength". Another important factor is % by which last earnings report beat analyists expectations.
sorry dc, I actually forgot you had a thread on RS and FA on stocks.
I will definitely be looking into RS and FA on stocks further in the future (when I get time, I just want to get this scalping thing out of the way first, longer time frames and FA seem to forming in my mind as my ultimate goal)
thank you for your contributions
belflan
Hhhhhaa.... (and relax)
much more relaxed over here on this thread
'Take it easy' as Vegas would say
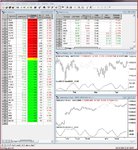
ok, will be looking to enter long (portfolio) as attached when indu 10min macci gives an entry
will hold and exit on daily indu macci (rotate stocks as required)
belflan
much more relaxed over here on this thread
'Take it easy' as Vegas would say
ok, will be looking to enter long (portfolio) as attached when indu 10min macci gives an entry
will hold and exit on daily indu macci (rotate stocks as required)
belflan
Attachments
Similar threads
- Replies
- 309
- Views
- 114K


