Just some final comments on wicks and tails. You know it has come to an end when it closes above the upper bollinger band and doesn't sell off. That happened at 9:15 when the 5 min candle closed at its highs at 5715. I didn't take the long when that happened because there was resistance at 5717. I actually went long at 5714.5 at 9:31am, after the pullback and entered on the continuation back up.
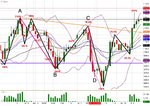
On the 1 hr chart we had retraced to 38% (this mornings low at 5696.5) and then it reversed back up and made a new high above yesterday evenings high. That's pretty bullish usually.
Finally, I don't know what it was that the Fed said that was new news and was worth the big rally. Maybe the market was already planning the move anyway. The FTSE had completed its ABCD pattern which is normally a bullish sign.