Dick Lexic
Veteren member
- Messages
- 4,954
- Likes
- 124
sorry should say i'm looking at 10 min chart
hi bj, el thicko is back🙂
have i got it right ......today 8:20 close at 5762 buy ...8:30 high 5774 potential 12 points?
4-5? Where you get that idea?
The 8:30s this week had roughly 16,18,61,60 (the last 2 ignored 9:00) potential (top to bottom)
The 9:00s 19, 45 L, L (last 2 since 8:30 not reversed)
The 10:00s 34,11,L,20
The 15:00s 34, 6, 64, 25
Sidekicker
Doesn;t seem like there's much chance to get into these arbitrages - they move quickly?!
Presumably 2 FTSE:1 DOW size ratio?
Can't get to the reply button you've filled up the screen!!
More than you might think. Here's the ftse differences so far this January.

Why not 09:30, 1hr after open? Read a book once that claimed all the big trades were done in the 1st hour. I know it often happens but it seems a bit arbitrary...it's not like if I were a fund manager, I'd spend 60mins exactly firing off trades and then go "oh 10am, better stop this nonsense and get a cuppa".
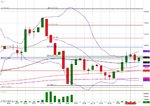
Perfect Bullish Gartley this morning and smack bang on the value area low from yesterday .. AND on multiple fib support..
Doesnt get much better than that 😎
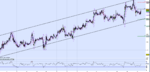
Barjon let me know what you think of these charts. I have always liked what you do in theory but I just don't understand how you execute the hedge with the strength or weakness in your favour. I tried using the relative strength indicator on my charts but I could see no clear way to derive the direction. I noticed on IG you can trade the difference between FTSE and DOW so I loaded up the chart and you can clearly see how this year the DOW has gained strength and I noticed there was a channel. Now I don't really know if you can apply any sort of analysis to this chart but I drew a channel and the value looked to be peaking. Just after 3pm I took a short position on the DOW with a plan to hedge FTSE long. The trade never went in the red so I did not bother but if I had the net value would have been positive by 40+ points.
Am I sort of on your wavelength with this Barjon? Anyone else got any thoughts?
Also if you used it to hedge a loss you would need it to come in your favour during market hours. A stop is the safe bet 🙂
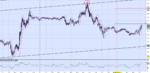
Done a little DOW/FTSE ratio work here:

s&p just got back over 61fib hourly cash
still bouncing ....boing boing
Dick, on the futures the ES retraced to 50% on the 1 hr chart. If it can make it above 1318 that should see a continuation back up.
Thanks, Sidekicker - I'll have to have a good look at that