I am not sure if we are done with the down move yet. We did just break the support level of 1305 on the ES, and on the 1 hr chart it does look like we have a h&S pattern. The next half hour will probably determine where we will go for the rest of the session. Too early to go into a range just yet.
You are using an out of date browser. It may not display this or other websites correctly.
You should upgrade or use an alternative browser.
You should upgrade or use an alternative browser.
It really seems to be reluctant to break below 1205 and stay below. I guess it is such a strong level that it really needs to have a good reason to go lower. It did break below it at 8:25am, and was forced back on some volume, so the bears are reluctant to go short again. So for now looks like a holding pattern, and probably a range on the Ftse futures of 5695 to 5718. If it breaks out of this range on any volume, I will be surprised and probably reluctant to get in on the breakout.
DaddyJohn
Experienced member
- Messages
- 1,375
- Likes
- 9
I think ES needs to get to 1302 .. as there are large gaps in the market profile between 1306 and 1302 .. hence why it is taking its time to ensure it prints enough volume into this range.. if it does drop then that take ftse Z to 5680 ish suppose where we have support
Sidekicker
Well-known member
- Messages
- 407
- Likes
- 11
Anyone seen this context model: Context Model » Capital Context - Mitigate Risks. Enhance Returns.
Presumably, you just find things that are closely correlated to the stock market:
AUDJPY, Bonds (inverse), Gold, oil, average their percentage moves for the day and then compare that to the index percentage move?
Presumably, you just find things that are closely correlated to the stock market:
AUDJPY, Bonds (inverse), Gold, oil, average their percentage moves for the day and then compare that to the index percentage move?
barjon
Legendary member
- Messages
- 10,752
- Likes
- 1,863
Dick Lexic
Veteren member
- Messages
- 4,954
- Likes
- 124
Dick, there was no spike on the underlying Futures chart. If the spike caused you to be stopped out of a trade by your spreadbetting firm, I would have a word with them and ask them to credit you. If they don't then take your business elsewhere.
thanks martin but no loss🙂
Little teasers aren't they?
I would prefer some Malt teasers right now. Time to raid the kids chocolate stash. Don't tell them.
The 20 EMA on the 5 min chart is holding very well today. Market still seems bearish and not putting in any sustained rallies.
Dick Lexic
Veteren member
- Messages
- 4,954
- Likes
- 124
my 2p's worth says 5750 cash is key....some volume building underneath this area... volume key at the mo 40ish cash....so it's back up over 750 or down to test yesterdays low at 22 maybe lower......
can't find buzz lightyear🙁
can't find buzz lightyear🙁
I just plucked out a couple of current H1 futures charts (sb version i'm afraid 🙂) to show the consistency of the ftse/dow relationship over time, although you can spot the period of ftse weakness within it.
Jon, I think some of that weakness might have actually been strength in the Dow. The FTSE options expiry had happened at 10:15am, resulting in a sideways drift. The DOW cash components had not had their options expiry until the end of the day. I think a lot of people were hedging their positions and I think the price of the individual US stock options were forced higher into the end of the day. That might have accounted for the difference.
DaddyJohn
Experienced member
- Messages
- 1,375
- Likes
- 9
my 2p's worth says 5750 cash is key....some volume building underneath this area... volume key at the mo 40ish cash....so it's back up over 750 or down to test yesterdays low at 22 maybe lower......
can't find buzz lightyear🙁
spot on Dick.. which is around 5710 futures .. which is where it is heading now methinks
Dick Lexic
Veteren member
- Messages
- 4,954
- Likes
- 124
spot on Dick.. which is around 5710 futures .. which is where it is heading now methinks
di ..you'll prob have seen it also tested an older volume area so we'll see if it confirms🙂
Dick Lexic
Veteren member
- Messages
- 4,954
- Likes
- 124
I am not sure if we are done with the down move yet. We did just break the support level of 1305 on the ES, and on the 1 hr chart it does look like we have a h&S pattern. The next half hour will probably determine where we will go for the rest of the session. Too early to go into a range just yet.
talking about h&s patterns check out the monthly monster.....fortunately the s&p seems to have broken it 's own h&s to the upside so hope we follow
Attachments
talking about h&s patterns check out the monthly monster.....fortunately the s&p seems to have broken it 's own h&s to the upside so hope we follow
It looks pretty grim if it fulfills that pattern. I am not ready to retest the lows.
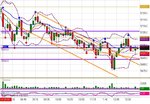
On days like today where there aren't really any decent rallies, I use the 20 EMA on the 5 min chart as a guide for continuations. In the attached chart note how the price tries to get above the 20 EMA (blue line) but fails to close above it. Only once did it do it at 9:10am, but that didn't stay there long. On 3 occasions it bounces off the line and goes on to make a new low for the day.
Attachments
Last edited:
DaddyJohn
Experienced member
- Messages
- 1,375
- Likes
- 9
talking about h&s patterns check out the monthly monster.....fortunately the s&p seems to have broken it 's own h&s to the upside so hope we follow
Just finished reading an independent report on the UK economy.. seriously makes you want to emigrate...!!!
If US economy is even half as bad as what shape we are in , then god help us.
DaddyJohn
Experienced member
- Messages
- 1,375
- Likes
- 9
check out the potential 2 step Gartley on the short term charts (1-3min)
if this baby now comes down to 5682 ish.. then watch for the rebound up to 5710
look for support at 5682 .. trigger it and let it go:whistling
no longer a Gartley!!!!
Similar threads
- Replies
- 1
- Views
- 2K