A Master Class in FX Intraday Trading by F & Co

Status
Not open for further replies.
c
hart update
 

Attachments

  • sc3.PNG
    sc3.PNG
    645 KB · Views: 141
update on that target and why

Hi MM,

It's a pleasure to read your trading.:smart: I don't understand how you managed to get as target 5157....it was accurate to the pip!(y) I guess you got it from your pitchforks...could you please elaborate a bit on that?
I still haven't read the pitchfork book you recommended, but it's next on line after my current reading.

Cheers,
Keen246
 
MM..................good to see the videos and the results .............

heres a victory roll for you to add to the party ................this is sooo cheesy but I love it ............happy memories and global travel experiences for me whilst this song was a hit ............

 
Case Study - All Day with the EA - Friday 18th Dec 2015

I think all Traders will have their own favourites pairs they like Trading

For me over the last few years I had preferred the EJ - -ie EU / AU / NU / UJ I found a bit too slow intraday - and so it was a toss up with the EJ or GU - simply because the GJ and GA were a bit too volatile and the spreads on my previous broker were a bit too large.

Nowadays and certainly in the later half of this year - the Eur - Aud ( EA ) is now firmly my favourite for my way of trading.

It will not be always the top mover - that maybe goes more with the Pound crosses or some odd exotic pair - but it suits my style and the spread and cost are tight enough for scalping in slower times.

It was good to see Major Magnum trading it yesterday - and also to see his take on it.

With us both living in the UK - we are fortunate to be able to enjoy a full working day session of over 12 hrs if need be - and those 12 hrs are the busiest in the 24 hr trading day

I started yesterday around 6 00 am and had finished by 4 00pm and basically caught 3 of the main 4 moves that took place over 12 - 16 hrs.

I was not around for a full 10hrs ( 6am to 4 pm ) to just trade every hour - in fact maybe 5 hrs maximum and the EA was not my only pair - it was just one of 4 pairs .

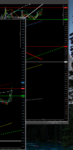
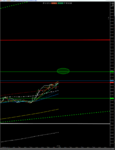
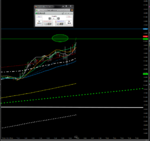
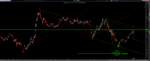
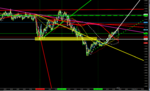
Lets look first at my chart - ( yes a messy one) and we can see really 4 main moves - each one over 75+ pips - with the largest being just over 150 pips

210410d1450531026-master-class-fx-intraday-trading-f-co-ea-181215-pm.png


The 4 in total add up to approx. 400 + pips - of single counts ( not counting multi stakes and partials) and any trader catching over 150 -200 pips during the day would have done exceptionally well

How I saw it -

First Point - 30 min and 60 min time rules on highs and lows - such a major clue

Second Point - Key Times & Time windows

Third Point - Interim levels of both supports and resistance or supply or demand or bull and bear or what ever you want to call them ( LiTs Areas)

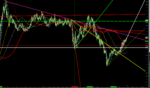
Fourth Point - LR set up - both the scalping settings and the structure from the longer term - Note my RED/ YELLOW / GREEN mid range set ups for the traffic light sequences

Fifth Point - Price Action alone is not enough - even on a 1 min chart - you need to know the price structure based on levels and time

Sixth Point - Importance of catching interim Tops and Bottoms - its key for any experienced FX Intraday trader . Don't listen to less experienced who say it cannot be done - I and many others do it everyday - we will never be 100% correct - anything over 60 -70% accuracy is a very successful method if used in conjunction with tight stops and partial stake already with stops in profit.

Seven Point - Correlations with other pairs - ie is the Euro strong - or the Aussie Dollar for the hour part you are trading?

Eighth Point - Red News and markets game plan - including stop hunting - move 2 yesterday was made into a stop hunt - similar with move 4

Ninth Point - Confidence along with Experience and Focus - Don't let the market frighten you. Its your boss - yes - but treat it with respect - accept being wrong with losses and realise just one or two trades a day on a pair is not really the answer if you want a high return from your capital along with low risk

Tenth Point

Rarely do you get just one direction over 12 + hrs - ie without any pullbacks either way of over 50+ pips on the EA. Its certainly possible if you have the experience and time available to make over 50 pips just off the EA every trading day

I certainly cannot say that about the EU ;-)


Regards


F
 

Attachments

  • EA - 181215 PM.png
    EA - 181215 PM.png
    125.9 KB · Views: 810
Last edited:
Hi MM,

It's a pleasure to read your trading.:smart: I don't understand how you managed to get as target 5157....it was accurate to the pip!(y) I guess you got it from your pitchforks...could you please elaborate a bit on that?
I still haven't read the pitchfork book you recommended, but it's next on line after my current reading.

Cheers,
Keen246

Very kind remarks Keen,
here are some charts. i have used many to showe different angle etc.

Ok chart one is stripped down m1 showing a strong break of 61.8 red fib fan. Also , notice how since 20:00 above 23% green fib fan line.
Yellow vertical lines show some scalp times that were good in hindsight.
Horizontal yellow lines are for me key above and below lines.
So by 20:30 price had broken and held strongly above the congestion area outlined by both of the lines.

Chart two
this green pitchfork was doing ok. Where was resistance from it at market close time?

Chart 3
shows this price point historically. Blue circles where it held price. Yellow circles where it needed oomph to push through this line. Purple circles where where price used it as a trampoline.

Chart 4 (file eapitch)

see how price has failed to reach the red dotted WL1 (warning line one) .
If we apply Hagopian gap principle, price should reach above the top of the preceding leg down. Granted, that is AT P2 OF THE GREEN PITCHFORK ( NOT LABELLED) which is a long way away. BUT, where might there be key resistance on the way up. My two green arrows show two such possible points. I notice two of my green dotted parallel lines are out of whack. Sorry, this happens when I adjust timeframes back and forth. I have removed them on chart 5. they were not showing anything anyway.

so continuing by looking at chart 5, look how the pink sliding parallel also coincides with the trigger line (red dotted) that belongs to the red broken pitchfork. That is strong resistance RIGHT THERE!!!!! more context is that its not uncommon for a key dynamic line to be retested. Tim Morge calls it having one last look through the door just exited, which I like.
Chart 6

we are about to challenge the yellow rectangle area.

Chart7
look how the longer lr lines, especially red dotted and white dotted have mature since 16.30
notice we are right under the fat red lr. If we can get above that, then..... if the faster sets can get above that, then......


chart8


I have used pink target lines to show where time (market close) and price (horizontal pink line) and dynamic resistance ( pink line from top of leeft hand chart) all meet
 

Attachments

  • chart5.PNG
    chart5.PNG
    197.8 KB · Views: 90
  • eapitch.PNG
    eapitch.PNG
    141.6 KB · Views: 141
  • chart3.PNG
    chart3.PNG
    139.7 KB · Views: 149
  • chart2.PNG
    chart2.PNG
    70.7 KB · Views: 142
  • chart1.PNG
    chart1.PNG
    141.4 KB · Views: 165
MM..................good to see the videos and the results .............

heres a victory roll for you to add to the party ................this is sooo cheesy but I love it ............happy memories and global travel experiences for me whilst this song was a hit ............


too kind too kind. that made me laugh!
 
Laugh ?.......that's a bloody lush video......you young pups need to respect the cheesy rubbish f and I were brought up on .......Jees I even bought a flying jacket to wear and a dodgy pair of fake raybans from Croydon market

Hahahahahahaha:LOL:
N
 
Laugh ?.......that's a bloody lush video......you young pups need to respect the cheesy rubbish f and I were brought up on .......Jees I even bought a flying jacket to wear and a dodgy pair of fake raybans from Croydon market

Hahahahahahaha:LOL:
N

dont get me wrong, me and mates loved it for the scene with the Gpz550
 
dont get me wrong, me and mates loved it for the scene with the Gpz550

This is me in Thailand in the late 80s creating that scene.......I wasn't kidding when I said it was influential,in some of my global,travels

That sooo. Damn butch it hurts eh ?:cool::LOL:

About the only damn time I was actually on the thing .....every time it rained. the slicks put me in a ditch .......so about 20 times a day then :LOL:

N
 

Attachments

  • image.jpg
    image.jpg
    1.3 MB · Views: 108
Very kind remarks Keen,
here are some charts. i have used many to showe different angle etc.

Ok chart one is stripped down m1 showing a strong break of 61.8 red fib fan. Also , notice how since 20:00 above 23% green fib fan line.
Yellow vertical lines show some scalp times that were good in hindsight.
Horizontal yellow lines are for me key above and below lines.
So by 20:30 price had broken and held strongly above the congestion area outlined by both of the lines.

Chart two
this green pitchfork was doing ok. Where was resistance from it at market close time?

Chart 3
shows this price point historically. Blue circles where it held price. Yellow circles where it needed oomph to push through this line. Purple circles where where price used it as a trampoline.

Chart 4 (file eapitch)

see how price has failed to reach the red dotted WL1 (warning line one) .
If we apply Hagopian gap principle, price should reach above the top of the preceding leg down. Granted, that is AT P2 OF THE GREEN PITCHFORK ( NOT LABELLED) which is a long way away. BUT, where might there be key resistance on the way up. My two green arrows show two such possible points. I notice two of my green dotted parallel lines are out of whack. Sorry, this happens when I adjust timeframes back and forth. I have removed them on chart 5. they were not showing anything anyway.

so continuing by looking at chart 5, look how the pink sliding parallel also coincides with the trigger line (red dotted) that belongs to the red broken pitchfork. That is strong resistance RIGHT THERE!!!!! more context is that its not uncommon for a key dynamic line to be retested. Tim Morge calls it having one last look through the door just exited, which I like.
Chart 6

we are about to challenge the yellow rectangle area.

Chart7
look how the longer lr lines, especially red dotted and white dotted have mature since 16.30
notice we are right under the fat red lr. If we can get above that, then..... if the faster sets can get above that, then......


chart8


I have used pink target lines to show where time (market close) and price (horizontal pink line) and dynamic resistance ( pink line from top of leeft hand chart) all meet

Thanks a lot MM for that comprehensive reply. I'm gonna study it in detail. I always learn something new from you.(y)
Cheers,
Keen246
 
Monday 21st December 2015 - Pre Opens

Good Morning to all FX Intraday Traders

Clean scalp buys on the EU and GU from 6 00 am this morning - makes a change on those 2 pairs

Both are in bull price structures for the session - and both have done what they should have been doing - rather than being manipulated and played with to deceive Intraday Traders.

With it being Christmas week - I don't plan to be covering full days - maybe just a couple of hrs prior to 11 am and then a couple of hrs after the start of the US session.

I am not going away and so even plan to get a few days trading in over the holiday break and before January 5th onwards when things start to get back to normal.

Please feel free to join in with your charts and comments - being calls - plans thoughts, forecasts etc on any FX pairs you might be trading.

Have a great week and finish the year off in a positive way

Regards

F
 
Status
Not open for further replies.
Top