3rd generation NN, deep learning, deep belief nets and Restricted Boltzmann Machines

I discovered this like few years ago that random shuffling don't impact results
but i repeated this test to be sure so here they are. Trading time January 2014
21 trading days. As you can see no impact....so no real time series...
In 1st result line

groups = groups(randperm(N));

is commented out

Krzysztof

EURUSD SL15 TP30 RSI50 RBM20

ALGO RESULTS
Profit PP AC MC Kappa p PF WL
-500175.00 29.74 0.34 -0.32 -0.31 0.00 0.48 0.13

and after random shuffling

%Create batches
numbatches= ceil(N/batchsize);
groups= repmat(1:numbatches, 1, batchsize);
groups= groups(1:N);
groups = groups(randperm(N));
for i=1:numbatches
batchdata{i}= X(groups==i,:);
batchtargets{i}= targets(groups==i,:);
end

ALGO RESULTS
Profit PP AC MC Kappa p PF WL
-472372.00 29.40 0.34 -0.33 -0.31 0.00 0.48 0.12

Model building is clearly independent of shuffling. However the results on a testing set are dependent on whether the data used for the building of the modeling contains or does not contain future data. So I am not talking about shuffling of the data used to build the model but about the presence of future data inside the model relative to the data being predicted (data-snooping bias).
 
OK, shuffling is shuffling but future leaks are future leaks and its another story. Future leaks simply means that you learn and evaluate on the same (at least partiallly) data so results are inflated but that shuffling don't cause any harm can mean that:

a) algo was not sensitive enough to dedect it and explore it

or

b) FX is not real time series but time independent collection of patterns.

Krzysztof
 
Last edited:
OK, shuffling is shuffling but future leaks are future leaks and its another story. Future leaks simply means that you learn and evaluate on the same (at least partiallly) data so results are inflated but that shuffling don't cause any harm can mean that:

a) algo was not sensitive enough to dedect it and explore it

or

b) FX is not real time series but time independent collection of patterns.

Krzysztof

I would go for a) since your algo wasn't able to get above-chance predictive power. In order to test the time dependence problem you need to find a machine learning technique that at least offers some ability to predict. Otherwise it is insensitive to the features that reflect the time dependence issue. You will always find time independence in a time-dependent problem where the machine learning method has no predictive capacity.
 
Last edited:
another example

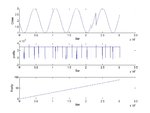
here you have another example - I replaced the timeseries with 2+sin(0.001*x) so for sure time dependendent series

and result before shuffling

ALGO RESULTS
Profit PP AC MC Kappa p PF WL
8853197.72 99.09 0.99 -0.00 -0.00 0.91 1370.11 99.13

ALGO RESULTS BUY SIDE
2777021.11 99.25 0.54 0.02 0.00 0.74 2.35 1.18

ALGO RESULTS SELL SIDE
1747099.85 98.86 0.99 0.98 0.98 0.00 1.73 0.87


and after random shuffling

ALGO RESULTS
Profit PP AC MC Kappa p PF WL
8853927.70 99.13 0.99 -0.00 -0.00 0.86 1467.76 99.47

ALGO RESULTS BUY SIDE
2777021.11 99.28 0.54 0.02 0.00 0.77 2.35 1.18

ALGO RESULTS SELL SIDE
1747099.85 98.87 0.99 0.98 0.98 0.00 1.73 0.87


so no real change even time dependence was destroyed, Seems RBM is able to deal with it anyway. So all theories must be proven with hard numbers otherwise they are just theories.

Krzysztof
 

Attachments

  • ALL_RBM20.jpg
    ALL_RBM20.jpg
    73.5 KB · Views: 260
here you have another example - I replaced the timeseries with 2+sin(0.001*x) so for sure time dependendent series

and result before shuffling

ALGO RESULTS
Profit PP AC MC Kappa p PF WL
8853197.72 99.09 0.99 -0.00 -0.00 0.91 1370.11 99.13

ALGO RESULTS BUY SIDE
2777021.11 99.25 0.54 0.02 0.00 0.74 2.35 1.18

ALGO RESULTS SELL SIDE
1747099.85 98.86 0.99 0.98 0.98 0.00 1.73 0.87


and after random shuffling

ALGO RESULTS
Profit PP AC MC Kappa p PF WL
8853927.70 99.13 0.99 -0.00 -0.00 0.86 1467.76 99.47

ALGO RESULTS BUY SIDE
2777021.11 99.28 0.54 0.02 0.00 0.77 2.35 1.18

ALGO RESULTS SELL SIDE
1747099.85 98.87 0.99 0.98 0.98 0.00 1.73 0.87


so no real change even time dependence was destroyed, Seems RBM is able to deal with it anyway. So all theories must be proven with hard numbers otherwise they are just theories.

Krzysztof

The time dependence here is periodical so the example is irrelevant to the issue of financial time series. If you want to test this you need to use something that is alike a financial time series (exactly the same class of time dependence). Periodical examples are not an accurate proxy to the issue ;)
 
Last edited:
The time dependence here is periodical so the example is irrelevant to the issue of financial time series. If you want to test this you need to use something that is alike a financial time series (exactly the same class of time dependence). Periodical examples are not an accurate proxy to the issue ;)

PS: Try to generate a series with an autocorrelation lag that changes as a function of a periodical function through time.

Can you give reference to those statements with any research paper or hard result numbers ?? Some guys like John Ehler since a lot of years make a living from market cycles and it is easy proof able. Just enough to filter financial time series with High Pass filter and profitability of any strategy will be killed means they are cyclical and profitability it coming from long cycles.

what does it mean
exactly the same class of time dependence

Krzysztof
 
Can you give reference to those statements with any research paper or hard result numbers ?? Some guys like John Ehler since a lot of years make a living from market cycles and it is easy proof able. Just enough to filter financial time series with High Pass filter and profitability of any strategy will be killed means they are cyclical and profitability it coming from long cycles.

what does it mean

Krzysztof

I am not seeking to prove my point to you ;) I am just trying to provide you with some guidelines to help you out. You're clearly free to take anything you want and ignore anything you don't deem reasonable :smart:

Regarding the time dependence, you should realize that the market is not periodical in the same way a sine wave is periodical. For example look at the serial autocorrelation for bar ranges, do you see them behave in that way? Do you see any financial time series reproducing the exact same pattern over and over again with an exact periodicity? You will not find a feature of the market that is always repeated with the same periodicity in the exact same manner. Therefore if you want a proxy for a financial time series you cannot use a sine wave, it's a gross oversimplification.

Well, now I see that most likely those are just your theories.
So all is periodical, Fourier proved it like two or three hundreds years ago that all series can be shown as a sum of sinuses with different lengths - its a basics of DSP If we can benefit from it and measure those cycles fast enough before they disappear its another story.

Krzysztof
 
Last edited:
seem to work

So finally system based on AI seems to be profitable. It trades 4 currency pairs on 1min charts and being retrained every 24h. It was really hard to tune it, a lot of additional MATLAB scripts were needed to set up proper simulation, without pararell computing toolbox and a few multicore PCs it would be impossible for me to do a proper testing and evaluation.

See results.

Krzysztof
 

Attachments

  • scr2.jpg
    scr2.jpg
    594.1 KB · Views: 400
  • scr.jpg
    scr.jpg
    184.9 KB · Views: 292
  • results.htm
    4.2 KB · Views: 255
Last edited:
I did not go through the entire 24 pages but certainly the initial post's links about TradeFX are gone from the web!
 
trading

here is the example how this system works (GBPUSD 1min from last week)

top window exit signal
middle trade signal
bottom GBPUSD close.

it seems to start to generate trade buy signal after 1440 bars so on tuesday at 00:00 and signal lead the GBPUSD rally which occured later. Signal lasted 605 bars but exit signal occured after 435 bars.

The slow slide of GBPUSD which lasted till end of the week seems was not predicted/dedected

Krzysztof
 

Attachments

  • GBPUSD_PF35_Mayw1.jpg
    GBPUSD_PF35_Mayw1.jpg
    59.9 KB · Views: 467
here is the example how this system works (GBPUSD 1min from last week)

top window exit signal
middle trade signal
bottom GBPUSD close.

it seems to start to generate trade buy signal after 1440 bars so on tuesday at 00:00 and signal lead the GBPUSD rally which occured later. Signal lasted 605 bars but exit signal occured after 435 bars.

The slow slide of GBPUSD which lasted till end of the week seems was not predicted/dedected

Krzysztof

HI Krzysztof, glad you are still working on it. The persistent do win the races ;-)
from your last posts you claim you had some success recently, happy to hear that. Your last graph puzzles me a little bit tho. To me it is not really clear what i am seeing there, maybe you can shed some light. You say you are retraining every 24h, how far are you looking back? And how many trade signals you have on average? You simulate slipage too? Greetings

I look back 10000 1min bars. In parallel to matlab simulation i run also live test,
this week on 4 pairs it was open 6.74 lots so generated 674 signals. USD pairs were
profitable and JPY not. Have a look. In total whole account was slightly profitable.
 

Attachments

  • correl.jpg
    correl.jpg
    110 KB · Views: 289
  • symbols.jpg
    symbols.jpg
    163.4 KB · Views: 288
I look back 10000 1min bars. In parallel to matlab simulation i run also live test,
this week on 4 pairs it was open 6.74 lots so generated 674 signals. USD pairs were
profitable and JPY not. Have a look. In total whole account was slightly profitable.

Before trading this live, i would suggest you to run historical forward tests of a few years.. dont gamble :)
 
I'm not going to trade it with the real money at the moment even if it seems profitable. The live test is done on demo account and every week i see some nasty surprises which I'm trying to correct or improve so still a lot of work to do.

I already made a few months of forward test in MATLAB and it was looking great but when i went to details it turned out that it is kind of 'very extreme' trading like e.g. opening of 22 lots as 1 trade so trying to correct it also.
 
Last edited:
Hello, an interesting stuff was going on here, for quite a while now ! Good to see that somebody out there think alike. While searching for the same words which brought me here, I found another interesting link ::
https://bitbucket.org/tajo/deep-learning-for-algorithmic-trading-code

and some thought behind it ::
http://miksu.cz/d/deep_learning.pdf

Plesese check it it out. Though a newbie myself, I ran the code myself, for which I bought a new CUDA card (!). Got the same result, i.e. the market is miraculously random, even when the data set changed !! Rather than the algorithm itself, looks like the creative/imaginative feature extraction is the key factor in this deeep stuff.
 
Asirikuy F4 framework/FANN

Hi Krzysiaczek99,

It combines several NN, two based on classification, one on regression. However each one is profitable on its own as well. The systems are based on the daily charts, going lower is very hard in this manner (back-tests could take months), since I am constantly retraining the system for each trading decision.

The system is coded in the Asirikuy F4 framework (ANSI C) and the back-test was done on our python back-tester (the NST), however the back-test can also be done in MT4/5 with the same results (I only posted the NST image because it's much nicer in my opinion). The neural networks are implemented in the F4 framework using FANN but I also had success with other machine learning strategies implemented using the Waffles and Shark C libraries. It's very easy for us to do things like retraining machine learning approaches while this can be a nightmare on other platforms, etc.

I hope the above helps out :)

Daniel

Hi, looks like you've already done most of the things I'd like to try !! I'm trying to learn Python as a trading aid/analysis tool these days, and I see this name "Asirikuy" quite a bit here and there. I was wondering whether subscribing to his site (which looks a bit old) worth the money. Would you care to share your opinion on this please ?!

Cheers,
 
Top