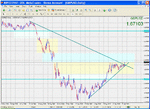
Month end analysis
Yesterday's post U.s GDP # rise in gbpusd resulted in a Daily and Weekly Bullish thrust candle close and a bullish Monthly hammer candle close. The uptrend extends from the 1hr to Weekly chart and price closed just off it's high on Friday, the last day of the Month.
Seasonal consensus is that August's low mid-summer liquidity can make for a difficult market, not something that bothers me on a 1min trigger.
Moving through the Monthly through to 1hr chart the analysis below outlines the previous near-term imbalances of demand/supply [=previous swing lo=previous support=potential support/sbr] / supply/demand [=previous swing hi=previous resistance=potential resistance/rbs] zones, unbreecehd fibs and trend lines.
Looking at Monthly chart there are 2 obvious near-term previous imbalances of demand/supply and supply/demand zones. These are a. the previous swing lo zone at the current yearly lows (3505) tested previously in September 200 thru January 2002 and before that in Feb 1993. b. A previous swing hi/lo zone from Jan 1997-Oct 1998/Nov 2005, that probably extends somewhere between 7045-7235. Just above this zone is the 50% fib of the current total 2.1162-1.3505 fall, @ 7325.

Turning to the Weekly chart and just above current price is a previous minor swing lo zone (=potential sbr) that extends 6774-7115 and in that zone resides the 50% fibs of the 0395-3505 and 0157-3505 falls @ 6945 and 6825 respectively. The overlap with the Monthly previous swing hi/lo zone (= potential resistance) discussed above is 7045-7115. Above here and another previous swing lo zone (less minor) extending 7436-7796 in which the 61.8% fibs of the said falls reside @ 7756 and 7606 resoectively, and below them the 76.4% fib of the more recent 8658-3505 fall. Thereare probably 2 x trend lines on this t/f, both some way off current price but shown on the screenshot below.

Looking at the Daily chart price is at the top extreme of the previous swing hi zone extending 6582-6745 and any break above this will encounter the potential sbr and other factors outlined on the Weekly chart analysis above. Below here and price found support @ or around the ascending support trend line joining swing lows in the move up from 11th March this year. A previou swing lo zone extends 6035-5980, ..5980 being the 23.65 of the 3505-6745 rise that held for the current run up to Friday's hi following the fall from 6745 that began on 30th June. Below there and 5942-5793 is previous swing lo zone. Should the current 6745 hi be breeched to the upside I will re-drwa a fib on this t/f from the low @ 5793.

On the 4hr price is at the top extreme of the previous swing hi zone 6660-6745 that co-exists with the daily prev swing hi zone detailed above overlapping 6660-6745. Friday's hi breeched the top of the ascending price channel that has developed as price has recovered off 5980 lows following the fall from 6745 that began 30th June. Below here and there exists a previous swing hi zone that extends 6585-6555 (-6523 possibly) with the 23.6% of 5980-Friday hi's 6732 @ the same place as the 38.2% of the 6262-6732 rise, - 6553/55. Below here and a previous swing lo zone begins at the 50% of 5980-6732 , - 6355 extending down to 6307 with another previous swing lo zone immediately below that 6038 to that 6262 Lo, the 61.8% of 5980-6732 at the6265 area.
Fibs shown on this t/f are 5980-6732 and 6262-6732 rise. Thereare also probably 2 ascending potential support trend lines.
Finally, the 1hr chart and below current price sees a previous swing hi zone (potential rbs) extending 6583-6555 (-6535 possibly) [and more recently 6573-64] in which the 38.2% 6337-6732 and 61.8% friday's b/o level 6470 - 6732 reside @ 6581 and 6570 respectively. This previous swing hi zone is co-existant with the 4hr prev sw hi zone discussed above. Below here and there is an abvious previous swing hi zone not marked on the screenshot because it is was breeched from the upside down to the post U.s GDP data b/o level but may act as potential rbs on any re-test, irt extends 6524-6498. 6490-70 is the previous swing lo zone around Friday's post u.s GDP # b/o level and the 61.8% 6337-6732 resides near the top of the zone @ 6481. The previous swing lo zone 6348-6337 and 6333-08 both co-exist with previous swing lo zones on the 4hr t/f.
A rising potential support trend line is also shown on this 1hr t/f.


