You are using an out of date browser. It may not display this or other websites correctly.
You should upgrade or use an alternative browser.
You should upgrade or use an alternative browser.
Articles
Filters
Show only:
Loading…
Key Points
Trading always involves some level of risk, but “risk” can be defined in many different ways.
Is it the probability of profit compared to the probability of loss? Or is it the amount you could earn compared to the amount you could lose?
Plus, how do you quantify risk? Is it the number of shares or the dollar amount?
Is options trading risky? This is a harder question to answer than you might think, because it depends upon how you define “risk.”
Most traders define risk in one of two ways. The first method is the probability of earning a profit versus the probability of incurring a loss. The second way is the amount of money you could lose compared to the amount of money you could earn. Let’s look at both...
Most of us would prefer not to relive 2015 it is my guess. Equity markets weren't very friendly with treacherous volatility towards the end of the year. Moving sideways from about June on, markets sneaked slight gains but most investors felt the burn of "nothing to show" for the year. China fears of slowed global growth and the increasing stockpiles of crude oil put a lot of downward pressure on the growth in equity markets around the world.
The Federal Reserve finally gave us hope in a Federal Funds Rate increase of 0.25% in December. Monetary policy baffles me. Central banks are seemingly more influenced by "sunshine or doom and gloom" trading headwinds than actual economic data. When the smoke cleared, the NASDAQ was up 5.73%, the...
For the hard-asset enthusiast, the gold-silver ratio is part of common parlance, but for the average investor, this arcane metric is anything but well-known. This is unfortunate because there's great profit potential using a number of well-established strategies that rely on this ratio.
In a nutshell, the gold-silver ratio represents the number of silver ounces it takes to buy a single ounce of gold. It sounds simple, but this ratio is more useful than you might think. Read on to find out how you can benefit from this ratio.
How the Ratio Works
When gold trades at $500 per ounce and silver at $5, traders refer to a gold-silver ratio of 100. Today the ratio floats, as gold and silver are valued daily by market forces, but this wasn't...
I believe that I can say the following without equivocation… throngs of traders around the planet continue to do the same disastrous things over and over while continuing to expect different results. They are moving stops, chasing trades, doubling down on losers, exiting trades prematurely and just generally digging a major hole in their portfolios that they may never recover from.
The Definition of Insanity
This horrible situation has been accepted as the definition of “insanity”. In other words, by engaging in the same processes and trading mistakes consistently you will remain in that rut; you’ll remain in a trading funk because there is no way that your outcomes will change if you keep doing the same thing. Furthermore, there is...
One of the primary benefits of trading options is the ability afforded to a trader to craft a position with specific reward/risk characteristics that are not available to the trader who deals only in the underlying stock or futures contract.
What this means is that the buyer of 100 shares of stock will make or lose $100 every time the stock rises or falls $1 in price. An options trader, however, is not limited to this straightforward equation; he or she can enter a position that will make money if the underlying security goes up a lot, goes up a little, stays in a particular range, goes down a little, and so on and so forth. The key to success is to understand the actual reward-to-risk characteristics for a given strategy and apply the...
Many books offering investing advice discuss how investor psychology plays a key role in determining an individual’s success in building and maintaining a strong portfolio. Investors need to be aware of their own personality traits and how those qualities could affect their decision-making process. Successful investors take advantage of their positive traits that lead to advantageous investing decisions, and either control or eliminate negative attitudes that cause bad investment decisions. A bad decision about when to sell a stock can cause a significant loss.
Bad Habits and Big Mistakes
While some bad habits can lead to flawed decisions about buying stocks, other bad habits lead to mistakes in selling or not selling investments. Many...
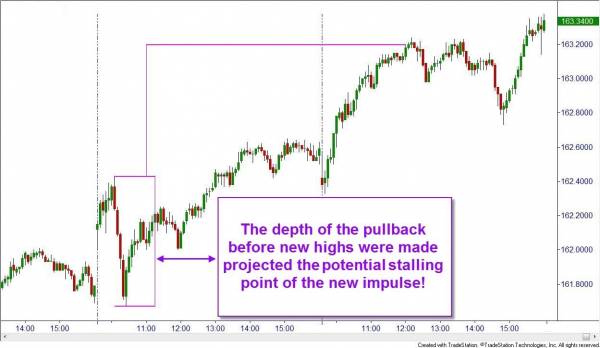
If you have been following the NASDAQ index, you know that prices have been making all-time market highs lately, even though the other indexes have been stuck in a range. There are a lot of stocks that are also at an all-time market high. As traders, we know that we should participate in the dominant trend but base our exits on supply and demand zones. The biggest question when a market high has been hit becomes: where are we supposed to exit when we do not have a supply zone to mark the top?
There are a couple of technical tools that we can use to identify probable targets for our trades, both intraday and on swing trades. It is important to note that none of these are as strong as actual supply zones but they do seem to offer higher...
Some 10 years ago any attempt to mention financial markets in a non-professional milieu inevitably hit the wall of skepticism: «Forex again?! Oh, spare us this rubbish, please!»
I would like to draw reader’s attention to a particular issue: this common reaction is based on the misconception known as fallacy of composition where the negative attitude towards Forex is inferred upon financial markets in general. Like it or not, that kind of attitude distorts the reality dramatically and we must figure out how to avoid detrimental generalizations.
It is obvious that this reality switch is rooted in the heavy advertising run by Forex brokers all over the world. The negative attitude is just an epilogue to the personal experience...
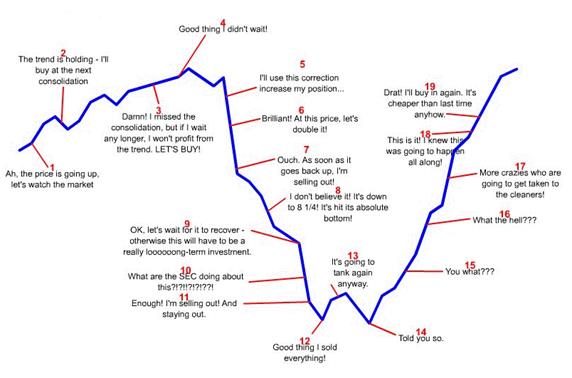
One of the biggest challenges to our own success can be our own instinctive behavioral biases. In previously discussing behavioral finance, we focused on four common personality types of investors.
Now let's focus on the common behavioral biases that affect our investment decisions.
The concept of behavioral finance helps us recognize our natural biases that lead us to making illogical and often irrational decisions when it comes to investments and finances. A prime example of this is the concept of prospect theory, which is the idea that as humans, our emotional response to perceived losses is different than to that of perceived gains. According to prospect theory, losses for an investor feel twice as painful as gains feel good. Some...
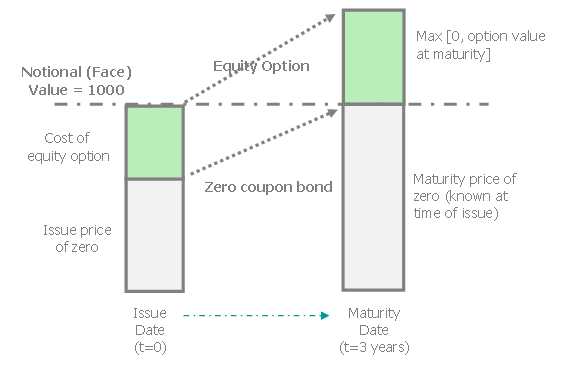
Once upon a time, the retail investment world was a quiet, rather pleasant place where a small, distinguished cadre of trustees and asset managers devised prudent portfolios for their well-heeled clients within a narrowly defined range of high-quality debt and equity instruments. Financial innovation and the rise of the investor class changed all that.
One innovation that has gained traction as an addition to retail and institutional portfolios is the investment class broadly known as structured products. Structured products offer retail investors easy access to derivatives. This article provides an introduction to structured products with a particular focus on their applicability in diversified retail portfolios.
What Are Structured...
Trading in the financial markets is stimulating, exciting and engrossing. But one can become addicted, just like with actual casino gambling or illegal drugs. Like any severe addiction, this can cost you your job, relationships and, of course, your financial resources. In this article we will consider what causes such addiction, the symptoms and how to break out of the downward spiral. Our focus is on the brain and understanding how its reward systems can literally train you to trade compulsively and dangerously.
German financial psychologist Norman Welz works constantly with these issues, as well as with the people affected, and his input and recommendations are reflected below.
The Temptations of Trading
You can make a lot of money...

Compare the average investor’s returns around the world to the average Wall Street firm’s returns. I think we would all agree that the average Wall Street firm is making the lion’s share of the money, while the average investor hardly ever comes close to achieving their financial goals. Next, think about what the average investor does in the markets; they “buy stock”. Now, think about Wall Street’s primary business; they “sell stock”. Hmm… One group is selling and producing very high returns each year, and the other, who is buying, struggles financially. And, this is happening in a market that typically goes up. Understand that I am not at all suggesting the average investor should stop buying stocks and start selling. What I am...
In almost all instances, the root cause of a financial crisis is an asset bubble. But how does this bubble form, what finally causes it to pop and how can investors profit before it goes bust?
In order for a market to attain the excessive valuations necessary to prompt a crisis, a prolonged period of price appreciation combined with a large number of new entrants to the market is usually necessary.
Crisis in the Making
The combination of price appreciation and an increase in new entrants to the market are defining characteristics of market bubbles. Investors should remember that many bubbles are based on attractive fundamentals, which explain why money flows into the market in the first place. However, at some point, so much money...
"To invest successfully over a lifetime does not require a stratospheric IQ, unusual business insights, or inside information. What's needed is a sound intellectual framework for making decisions and the ability to keep emotions from corroding that framework." Warren E. Buffett (Preface to "The Intelligent Investor" by Benjamin Graham)
Any veteran market player will tell you that it's vital to have a plan of attack. Formulating the plan is not particularly difficult, but sticking to it, especially when all other indicators seem to be against you, can be. This article will show why a plan is crucial, including what can happen without one, what to consider when formulating one as well as the investment vehicle options that best suit you...
Have you ever initiated a “revenge” trade? Most traders are well aware of this issue; but some of you may need an explanation.
What is Revenge Trading?
A revenge trade is a reaction to one or more losses. Let’s say that you had a good profit run of a couple of months. Your gains were in the 30% category and you were riding high and frequently breaking out into the trader “happy dance”. Then one morning you were feeling quite full of yourself with an illusion of infallibility. In other words, you felt that due to your string of wins you couldn’t lose. Your confidence had exceeded your competence. This irrational exuberance or trader’s euphoria clouded your vision and diffused your focus. Just then the price action inched toward...

Trying to pick an intraday top or a bottom in a market move can be dangerous, yet many traders are obsessed with trying to get in right at the bottom and out at the top. A common method is to forecast a bottom, place a bid and then watch in horror as prices continue to plummet, resulting in a larger loss than initially anticipated. Traders can get into emerging trends early and exit near the top, but a prudent strategy requires that we wait for the market to provide us with a signal - a sign that it is reversing - before we enter/exit our position. In this way, we can enter and exit at relatively good prices, but with the benefit of knowing what our risk is, and having a solid indication from the market that is has already turned...
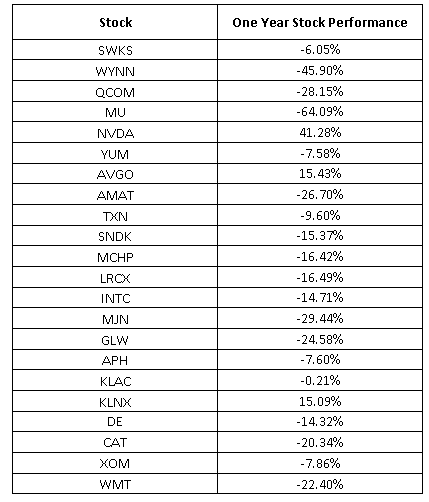
Does China matter? That’s a popular question throughout the investment community right now. The answer, however, is relatively simple: yes. Simple numbers can prove this point.
Earnings Performance
According to FactSet, U.S. companies that generate more than 50% of their revenue from overseas have seen a collective earnings decline of 11.2% for the fourth quarter. U.S. companies that generate at least 50% of their revenue domestically, meanwhile, have seen their collective earnings increase 2.7% in the fourth quarter. Overseas revenue doesn’t mean China only, but as the second-largest economy in the world with a massive population China, has the biggest impact. Unfortunately, the following words and phrases are currently associated...
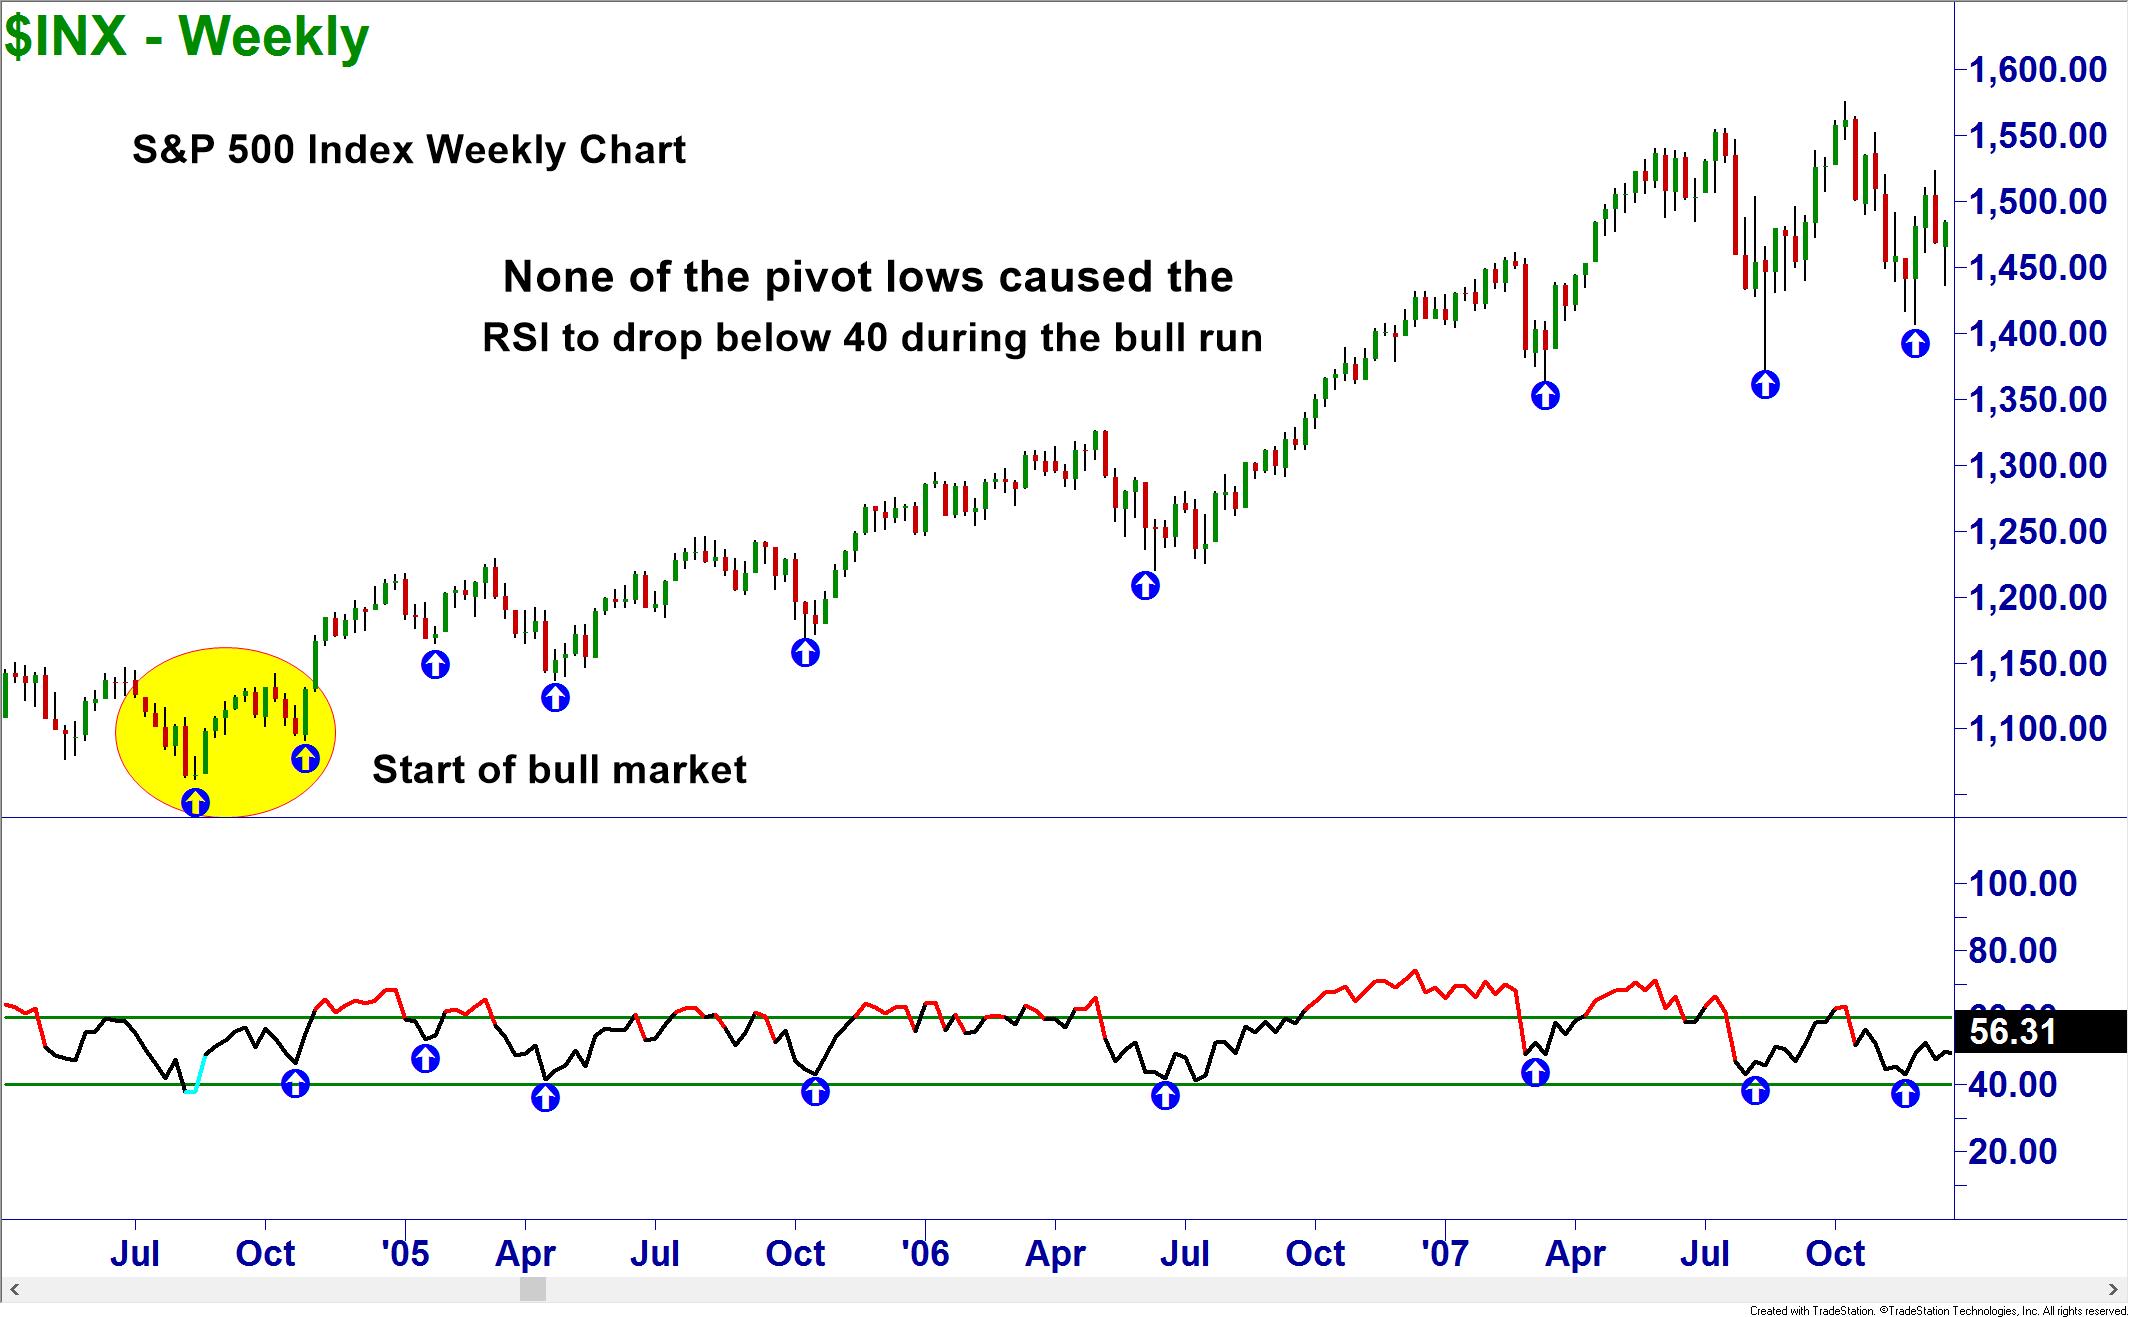
Technical indicators have long been misused by traders and investors alike. Many learn the traditional style of using the indicators and then try to massage the data to fit certain strategies of trading only to have them fail when the market conditions change. Others simply do not understand their use properly and misinterpret the data.
As a Chartered Market Technician and member for the Market Technician’s Association, I was required to gain a deep understanding of how most indicators and oscillators work. I was fortunate enough to learn some special tricks for using these indicators so that they work much better than originally intended, in any market!
One such modified indicator is the popular Relative Strength Index (RSI). I...
Thanks to online discount brokerages, anyone with an Internet connection and a bank account can be up and trading stocks within a week. This ease of access is great because it encourages more people to explore investing for themselves, rather than depending solely on mutual funds or money managers. However, there are some common mistakes that first time investors have to be aware of before they try picking stocks like Buffett or shorting like Soros.
1) Jumping in Head First
The basics of investing are quite simple in theory – buy low and sell high. In practice, however, you have to know what “low” and “high” really mean. What is “high” to the seller is considered “low” (enough) to the buyer in any transaction, so you can see how...
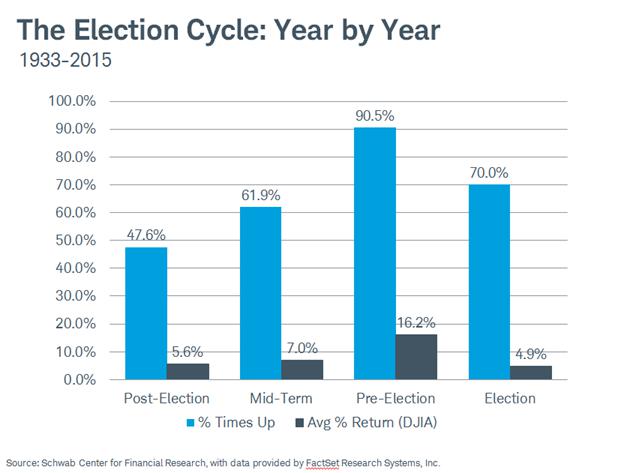
In November of 2016 Americans will choose a new president. A detailed study of history can give us some interesting clues on how the USstock market might behave regardless of who wins.
Many market analysts have noted a general tendency for the stock market to experience a meaningful price bottom roughly every four years. Of course, the exact timing from low to low does not always correspond to an exact four year cycle. Still, there does appear to be some correlation between the action of the stock market and the four year period that extends from one presidential election to the next. This is most commonly referred to as the “Election Cycle.”
The Election Cycle
The “Election Cycle” as generally defined, consists of the...
In all forms of long-term investing and short-term trading, deciding the appropriate time to exit a position is just as important as determining the best time to enter into your position. Buying (or selling, in the case of a short position) is a relatively less emotional action than selling (or buying, in the case of a short position). When it comes time to exit the position your profits are staring you directly in the face, but perhaps you are tempted to ride the tide a little longer, or in the unthinkable case of paper losses, your heart tells you to hold tight, to wait until your losses reverse
But such emotional responses are hardly the best means by which to make your selling (or buying) decisions. They are unscientific and...
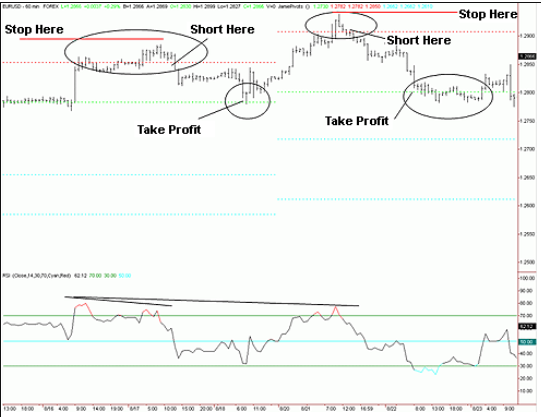
Trading requires reference points (support and resistance), which are used to determine when to enter the market, place stops and take profits. However, many beginning traders divert too much attention to technical indicators such as moving average convergence divergence (MACD) and relative strength index (RSI) (to name a few) and fail to identify a point that defines risk. Unknown risk can lead to margin calls, but calculated risk significantly improves the odds of success over the long haul.
One tool that actually provides potential support and resistance and helps minimize risk is the pivot point and its derivatives. In this article, we'll argue why a combination of pivot points and traditional technical tools is far more powerful...
Making investments can be a fun way to pass the time on a rainy day, but it can just as quickly destroy one's livelihood. Financial markets are cold and unfeeling; they do not forgive easily and are not to be trifled with. The line between "hobby" and "addiction" is a thin one. Compulsive trading will ratchet up your transaction costs, stress level and time spent away from the important things in life.
An Online Brokerage Account
Prior to the advent of the online brokerage, prospective investors had to go through financial intermediaries with access to stock exchanges, otherwise known as brokerage firms. The process, being arduous and costly, was a textbook opportunity for middlemen to step in and lower the transaction costs. In 1969...
My Background
I’ve been trading full time since 2000 when I was 23. Prior to that, I had been dabbling since I was 15.
I was hand drawing charts between other distractions of any teenager and placed my first ‘trade’ 3 days after my 18th birthday. I purchased some shares outright and got a nice pretty certificate through the post. The shares were bought at £0.54. Looking back, I was most likely suffering from very minor panic attacks daily as the price went from £0.54 to £0.48 almost immediately. Maybe two weeks later it was £0.58 - then £0.61. When it went past £0.70 - I was in a different type of panic.
The next few months were fitful and I don’t recall sleeping or doing anything other than rushing home from college to phone my...
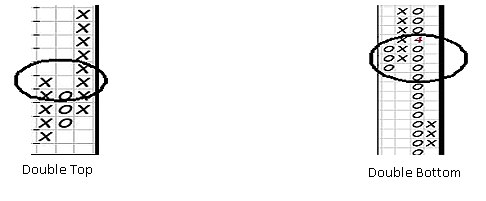
Point-and-figure (P&F) charts have been a part of the technician's toolbox for more than a century. They were used by Charles Dow in the late 1800s and Victor deVilliers published the first detailed explanation of this technique in 1933 in his book, "The Point & Figure Method of Anticipating Stock Price Movements". P&F charts track only price changes and ignore time. Proponents of this technique believe that focusing solely on price changes eliminates day-to-day market noise. By ignoring smaller movements, traders believe that it should be easier to identify significant support and resistance levels. In this article we'll introduce you to several popular P&F patterns that may be useful in identifying potential breakouts.
Using a...
There are many characteristics and skills required by traders in order for them to be successful in the financial markets. The ability to understand the inner workings of a company, its fundamentals and the ability to determine the direction of the trend are a few of the key traits needed, but not one of these is as important as the ability to contain emotions and maintain discipline.
Trading Psychology
The psychological aspect of trading is extremely important, and the reason for that is fairly simple: A trader is often darting in and out of stocks on short notice, and is forced to make quick decisions. To accomplish this, they need a certain presence of mind. They also, by extension, need discipline, so that they stick with...
Can the market predict a recession? A “yes” answer might seem tautological on the surface, but isn’t. A recession is technically a reduction in economic activity, rather than in stock prices. Rephrasing the question a little, is it possible to have, whether in the long term or the short, an environment of low stock prices and high real income (along with high industrial production and employment)? To the first part, certainly not if the population at large is relying on stock appreciation for its remuneration. But given that wages and salaries still make up the bulk of most people’s personal income, a bear market shouldn’t affect said income by all that much.
Information, Not Opinions
The data isn’t hard to plot. Sustained reduction of...
Your trading has a lot of nuances; those small or seemingly insignificant behaviors that in the final analysis make big differences. Consider the documentation process. Firstly, let’s acknowledge that it is critical to measure and keep a scorecard for your trades. If you are not measuring and memorializing your trades you’ve got some bigger issues; but if you are tracking your mechanical and internal data, then this missive is for you. Yes, recording your process is a critical cog to successful planning and follow-through; and you must consider many questions using the concept of appreciate inquiry to effect this progression. The topic of these questions revolve around the plan analysis, time frames, indicators, moving averages...
With the 2016 Presidential election just months away, the question often asked is: "How will the upcoming election affect the financial markets?" It's a fair and understandable question.
Elections generate world wide attention in the major economies around the world. There is no exception when considering the world's largest economy, the United States. The country will choose a new president in November and usher in a new era of the Free World. Such an event is significant to financial markets and to illustrate the point, one doesn't need to look very far. Many economists study such events for patterns and nuances trying to determine if there is a predictable relationship between elections and financial markets.
It may surprise you to...
