Where is the Dow & others heading in 2005?

Racer said:
Shhhhhhh, don't wake the bears up....
Have a read of this instead

One of the best free sites around IMHO. Plenty for the bulls too. Just a regular diet of solid geo-economic and political commentray that renders the mainstream media largely obsolete (for the reasons outlined in the article itself) - for me anyway. It isn't much use for ST traders but Nigel Maund isn't some nutty conspiracy theorist. Neither is Paul Volker (Alan Greenspan's immediate predessesor ) who knows a thing or two about Fed management and motivations and wrote along similar lines back in April.

Personally, I can feel a few 'parabolic spikes' coming on, before - before --- well doesn't bear too much thinking about really. The problem as always is timing it all. What I do know and will be guided by, is that all markets can continue with totally illogical excess for far longer than any brilliantly logical and well-read trader can remain solvent betting against them.

It's another of AG's 'conundrums' I guess.
 
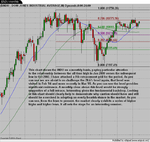
A look at the DOW from a monthly perspective.
 

Attachments

  • The big picture.png
    The big picture.png
    42.5 KB · Views: 226
roguetrader said:
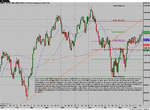
A look at the DOW from a monthly perspective.


That is interesting, it is a different chart compared to the one on Sharescope... that shows a big red candle for April 05 and the price action since then has not broken above, in fact the high of that red candle is 10663 and the 'open' at 10630, so I would not consider that recent action is a proper break up unless it goes above and holds 10630. If it fails here then this action since April is purely a test of the uptrend break that was in place since April 03 and Friday was a false break to the upside .. note the main movement was out of hours futures trading that made the Dow gap up at open, not what I would consider real buying pressure causing it to break above resistance and it failed to follow through for the rest of the day.

So it is all down to where your candles start and end I suppose!
 
Racer said:
That is interesting, it is a different chart compared to the one on Sharescope... that shows a big red candle for April 05 and the price action since then has not broken above, in fact the high of that red candle is 10663 and the 'open' at 10630, so I would not consider that recent action is a proper break up unless it goes above and holds 10630. If it fails here then this action since April is purely a test of the uptrend break that was in place since April 03 and Friday was a false break to the upside .. note the main movement was out of hours futures trading that made the Dow gap up at open, not what I would consider real buying pressure causing it to break above resistance and it failed to follow through for the rest of the day.

So it is all down to where your candles start and end I suppose!

Interesting indeed Racer, I would be inclined to poll a few more chart sources for an aggrigate view. Remeber this is the cash index and not the futures. The underlying is always king for me.
 
[Good chart Racer look like a big M (double top) then buckle up we are off down the slope. I have also read another post where 1320 for SPX was mentioned would probably tie in

Rustic
 
roguetrader said:
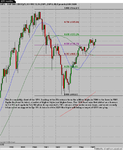
A look at the INDU daily, the smaller picture.
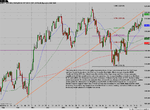
I agree that we are at a pivotal point in the Dow at the moment. The fact that 10600 was finally and convincingly breached after 4 weeks in the 10400 - 10600 consolidation range is bullish. It was also on the back of the second largest volume day this year. However it then spent the day tracking 10620 - 10640 and failed to move any higher. This could be a pause before an upside resumption back to 10900 or it could just be a fake head.

The key next week will be if it can convincingly move above 10660. If it can then 10900 could be on the cards. However if it falls significantly back below 10600, as the new resistance level, then we could see it heading back down to 10400 once again.

Wouldn't like to stake the farm on either option at the moment. Price action on Monday & Tuesday should provide the real answer.
 
Watch the oil price next week. Oil closed at $58.47 on Friday.

Many 'experts' believe that we will see $60 very soon due to the refining bottleneck. How much impact oil has on the market is open to debate. However last time it was at these levels (early April) it presaged a drop from the 10900 range back down towards 10000.

Just coincidence with the 'soft patch' or maybe more influential than some believe it to be.
 
Bluewave,
I'd actually classify that P&F chart as a consolidation looking likely to resolve itself soon... the bottoms are rising but the tops are dead flat - one or the other will undoubtedly give, but there are only probabilities to suggest which, and probabilities have the damndest propensity to be proved wrong <g>

Bullish for triple, quad or whatever it was witching, but it's very noticeable that the market failed to go higher - it got close to 10660 from the off, then touched 10645, then 10638, then 10637... bottoms are rising, tops are falling, it's a triangular consolidation or spring/coil whatever you want to call it. It isn't bullish or bearish, it's hesitating. I'd call it bullish if forced at gunpoint, it's certainly that rather than bearish, but it might still very easily drop back into that trading range - meantime trade the swings.

I don't believe the price of oil has provided a single pointer to the Dow, or (for that matter) any of the other fundamental information being mentioned here - it's all noise that improves analysis not a jot imo.

Dave
 
Futures heading lower, now does that surprise.. no not at all!
But that island could be smaller than I thought it might have been.. just have to see if they buy or sell into this gap down now
 
Shaping up for a bumpy start to the week, open gaps below may be filled, not much in the way of economic data this week, so we may get an early test of the bulls resolve. Volume on Friday was difficult to guage due to expiry. Looking for support to hold on the INDU at 10,578, and 1210 on the SPX. Nasdaq still has formidable resistance overhead at 2100.
I told her to correct to 2018 before moving up here, but she wouldn't listen 😆
 
where today for the dow

Dow been strong lately anyone got any ideas where it might head today.
Especially on open as sharp moves have been seen lately.
 
alanbeale2001 said:
Dow been strong lately anyone got any ideas where it might head today.
Especially on open as sharp moves have been seen lately.
Finally broke thru resistance on Friday but failed to capitalize on this. Will open down today because oil is over $59. No major news today other than lead indicators at 10.00am.

Needs to break through 10660 if it is going to move up and 10550 to move down. Could be a consolidation day between these two levels.
 
Choppy going here at the open, NYSE Internals firmly bearish at the moment
Leading Indicators data came in below estimates
 
Market in snoozeville, INternals still holding the lows. Of the sectors I watch only BTK is in positive teritory.
Total volume lacklustre.
 
Back
Top