Wallstreet1928 Analysis & live calls on FTSE,DAX,S&P...aimed to help New traders

Status
Not open for further replies.
S& P 875 top of the market for the interim

anybody else agree ?

yes I agree with that, the S&P has travelled a fair way for this leg and is due a retracement to consolidate if not re-test prior lows. 875 is a very strong resistance level so some shorting should be likely at that level.
 
Anyone watching Barclays? there has to be a good shorting opportunity there when it breaks out of this tight up trend channel in the 1 hour chart.
 

Attachments

  • Barclays.jpg
    Barclays.jpg
    162.7 KB · Views: 140
yes I agree with that, the S&P has travelled a fair way for this leg and is due a retracement to consolidate if not re-test prior lows. 875 is a very strong resistance level so some shorting should be likely at that level.

FTSE holding these levels will be based on oil staying above $50.50 ..............it has already failed to stay above £51.00
 
Right- my positions were:
+ftse @ 4095
+ftse @ 4088
+ftse @ 4097.8
+ftse @ 4092.5

all closed at 4106.8....total p&l = 53.9 points , plus 8.7 (and another 9.8 which i wont include because I didn't state when I did the trade)...daily profit= +62.6 points (+72.4 ponts if you add the other one)

That's it for me this week. Have a great weekend everyone!!!
 
Last edited:
Right- my positions were:
+ftse @ 4095
+ftse @ 4088
+ftse @ 4097.8
+ftse @ 4092.5

all closed at 4106.8....total p&l = 53.9 points , plus 8.7 (and another 9.8 which i write down do wont include)...daily profit= +62.6 points (+72.4 ponts if you add the other one)

That's it for me this week. Have a great weekend everyone!!!

well done my friend, impressive results !!

round of applause
:clap::clap::clap:
 
Right- my positions were:
+ftse @ 4095
+ftse @ 4088
+ftse @ 4097.8
+ftse @ 4092.5

all closed at 4106.8....total p&l = 53.9 points , plus 8.7 (and another 9.8 which i write down do wont include)...daily profit= +62.6 points (+72.4 ponts if you add the other one)

That's it for me this week. Have a great weekend everyone!!!

nice one !!
 
Just wondered what chart time frames people used? Do you think its useful to go any lower than a 5min chart? Or does this just give very mixed signals?

use more than one bennie. e.g. some people use a 1min to enter a trade, then a 10min to monitor/exit.

one thing though, be sure to check different time frames before you open a position. key signals (outside/inside bars etc) may only show up in one particular time frame.
 
i've just looked at an overlay of the 1938 DOW with a current DOW chart.

there's some interesting correlation in the stochastic showing the november slump, jan reversal and perhaps more importantly the march low. it was advised that it should be taken lightly however.

according to the 1938 chart, the low in march would be a bullish reversal, going on to highs in may, then july.

be interesting if it continues to correlate.
 
Good Evening my friends

been busy running around for the last few days and I have my first cricket match on saturday vs Bredbury St marks so I have been going to net practise. I am Number 3 batsmen(Ricky ponting..huh hum), so i need to get myself back in form for the outdoor season.
Heaton Mersey Cricket Club

Anyway, I'll get my TA cap on and see what i have been missing out on the evening action

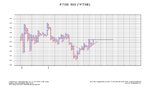
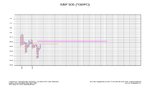
S&P 18th April analysis

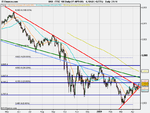
3 month 4 hr chart = 875 ...............I am surprised we didn't touch it today, but i will definitely be buying on a pull back as 875 target. Once it gets to 875 I will open up a short position

1 month , 1 hr chart = light blue tren line needs to be watched closely, I will be looking for a pull back to 858-860 and then buy with 875 target

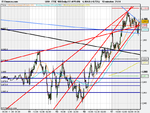
1 week 1 hr = 1 month 1 hr , wait for gap fill 858 and then buy

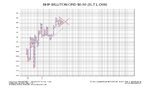
1 week 10 min = 20 MA could provide support in the interim @ 861 ........ wait for confirmation @ 858 and then go long

The above analysis worked like clockwork today

I went long upto 868 and then long again @ 870 being breached up to 875

and I have subsequently shorted at 875..1 ...stop loss 880

have a nice weekend every one

I'll be busy playing cricket over the weekend, looking forward to the posh teas of cheshire....haha!!
 
Last edited:
looks like a good day was had by all..well done
a market breadth chart.ie market internals
a bullish percent chart.it is the number of stocks in the index,their last signal was bullish.results caculated as a percenatage and then plotted as a p/f chart
basically over 70% of stocks in the index means it is technically overbought,under 30 % means it is oversold
readings are taken form a 1% box size/daily data chart with a 3 box reversal.ie medium term
last reading taken tonight is 79%
the index is overbought now.look out for the correction.
fom the chart it did go to 90% and then fell back
here is the chart
 

Attachments

  • S&P 500, USA Bullish % Index.jpg
    S&P 500, USA Bullish % Index.jpg
    123.8 KB · Views: 153
triangle fomed in bhp billiton
which way will it break.?
 

Attachments

  • BHP BILLITON ORD $0.50.jpg
    BHP BILLITON ORD $0.50.jpg
    170.4 KB · Views: 198
well 875 seemed pretty key on the spx. WS short to 860-ish makes sense, price support and trendline support around there.
 
well 875 seemed pretty key on the spx. WS short to 860-ish makes sense, price support and trendline support around there.


Good evening Dr Blix

I have just come back after watching the new Mike Tyson film and just noticed S&p at 870 ...........

I will amend position to break even and let it run
 
Weekend analysis - just before I go to cricket

birdseye - FTSE analysis

1 yr, daily chart - 4140-4150 = 23.6% retracement from the highs in june - interesting, i think I need to pay more attention to Fib levels!!
We Either break through 4140 upto 4320 or we fail and go back to trading below the monster red trend line


1 week , 10 min chart - 4110 and 4070 are two important areas

FTSE strategy for Monday 20th April

scenario A - if falls below 4070 and confirmed then short until 4040 & 4020(200 MA), monster trend line(black trend line) ...will provide support as previous resistance becomes support

Scenario B- If the market floats higher than 4110 with conviction then I will go long, target TBC

Scenario C - this scenario is dependant on Scenario A coming into fruition, I will then go long after a base or support is formed at 4040-4020(200MA), ideally 4030
 

Attachments

  • 180409.png
    180409.png
    23.2 KB · Views: 103
  • 18th  22.00.png
    18th 22.00.png
    27.2 KB · Views: 99
Last edited:
daily ftse is beginning to test the 125 MA, (once in jan 09 and twice apr 09) it hasn't been in positive territory since june 08.
 
i've been looking at the 1938 dow again. if the elliot wave theory holds a parallel, then i'm gonna predict a retracement to 3800 next month, followed by a new high in june/july. this is just for fun btw! i haven't got a clue about trading :)
 
unclear for monday so far on the ftse.the triangle broke to the upside.price now at a resistance.30 point box size.1 reversal hilo data plot
 

Attachments

  • ftse.upsidefailure.jpg
    ftse.upsidefailure.jpg
    121.5 KB · Views: 83
the most important chart i think.i have posted this one before.i think it will dictate the whole world markets.
we are in a treacherous zone.price looking for a triple-top break.if this happens ,then we get into the zone of a classic bull trap.swing traders beware
i have put on the chart the zone where the trap can occur.between the black and the purple line
 

Attachments

  • bulltrap.jpg
    bulltrap.jpg
    112.9 KB · Views: 111
Status
Not open for further replies.
Top