TZ Futures
Active member
- Messages
- 131
- Likes
- 0
FTSE 100 (Cash Levels for today)
FTSE 100 (Cash Levels for today)
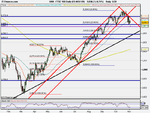
Update 07:30 GMT
Current Level: 5054
Support: 4992, 4950, 4906
Resistance: 5109, 5173
I will now highlight important levels underlined as above. If these break expect a huge reaction.
Volatility Index rose by another 3% yesterday, making these markets extreme conditions to trade in. Although the overall picture is still down, our resistance levels get hit before reversing again. I am neutral to bearish at this stage and will still close any long positions and go fairly short on any strength today.
Below 4950, its totally bearish.
Above 5173, its bulls all the way.
FTSE 100 (Cash Levels for today)
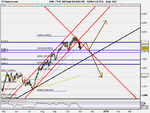
Update 07:30 GMT
Current Level: 5054
Support: 4992, 4950, 4906
Resistance: 5109, 5173
I will now highlight important levels underlined as above. If these break expect a huge reaction.
Volatility Index rose by another 3% yesterday, making these markets extreme conditions to trade in. Although the overall picture is still down, our resistance levels get hit before reversing again. I am neutral to bearish at this stage and will still close any long positions and go fairly short on any strength today.
Below 4950, its totally bearish.
Above 5173, its bulls all the way.