Dentalfloss
Legendary member
- Messages
- 63,404
- Likes
- 3,726
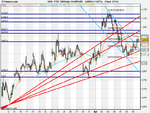
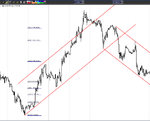
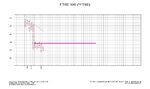
WS, i think you have your fib in the wrong position. forgive me if i've misinterpreted your chart, i'm just learning, but i read that to forecast a chart after a high, the fib must be started from the top, not the bottom, and it must be started from the bar NEXT to the high, as this is taken as the beginning of the new trend (and not the end of the up trend), which would be 4124.
the fib would prob end at 3855(ish) as the second major upswing is where it should be located.
also, i understand that trend lines, s+p fib etc should be drawn from candles main bodies, not their extreme ranges.
obviously, if you know better, ignore me, and plz correct me! it's just what i'm reading at the mo (constance brown - technical analysis).
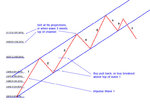
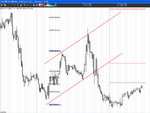
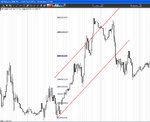
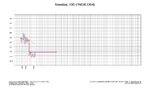
Another FTSE example - fib projection of 161.8% hit. Was there 5 waves, or was the 3rd wave subdivided into 2, well actually it doesn't matter - all you need is an impulse wave 1 for this approach.
In some of these examples I have cut the tails off some of the candles, when drawing the bottom channel line (acceptable with hindsight I guess) - FWIW, it could be safer not to do this in realtime.
I've shown 30 min charts, but these formations are visible on all time frames. Just be aware, there may not be a 3rd wave.
Enjoy the rest of your weekend everyone.
don't stop my friend, I'm listening and learning
whilst watching Match of the day
Torres goal was amazing today, Mr Macheda saved uniteds bacon again and Bolton almost gave Chelsea a scare.......... interesting weekend!!
Hi all,
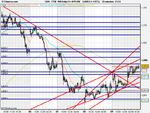
i was checking the Monthly/Weekly/ Daily Ftse Candle charts and i noticed
that th DAILY LOWS of the 24th and 26th of March, together with April 1st and 8th
are +/- 1pt of each other, with a good up day on the 9th April. The more points
of contact on a Support/ Resistance line the better ??? :clap: