SuddenDeath
Legendary member
- Messages
- 14,063
- Likes
- 143
doesn't appear to be any important market moving economic news being released today
went short @ 4375 and took + 5 ninja pts
bit stupid really, but now i'm + 24 pts and am happy that my daily target is properly hit (don't shout at me lapa 🙂)
looks like we're starting to have a slow down on the rate of fall now and theres bullish osc div but only on the 5 TF.
doesn't appear to be any important market moving economic news being released today
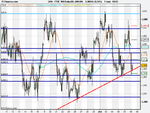
potential long back upto 4400 (and 21MA)?
EDIT: aah, you're already in there lapa!
i am long ftse
4378... stop loss 4358
target 4400
Yeah. neither today or tomorrow.
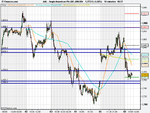
Long @ 4372 - that bottom trendline looks strong with no 10M bars closing over S2
4366 tested twice, next shadow @ 09.15 didn't reach S2, no 10M bars closing beneath 4375 - and I'm really liking that bottom trendline. Think I got a good entry - only took 6 points off that fall earlier so would like something from this.
I have closed for 10 points profit.........
I am not happy with set up
good call lapa, was very hard for me not to open a position too.
what S&R are u using? cams?
looks like it's moving sideways from it's little up trend now...
No, I don't use camarilla pivots. Floor pivots yes.
interesting, you like to calculate your daily pivots from real time info?
if that's what you mean, i like to do that too, using historical data seems to be 50/50 i've found.
WS, could I ask what about this set up you didn't like?
The last two ascending candles 09.30/09.40 on the 10M are a sign of weakness for me.
I am concerned about S&P 933 level ..............if violated then 923 next level!!
and that will bring everything down with it ...........
DAX below 5000 and it was looking weak @ the time ............
and a few other stocks looked vulnerable........!!
better to be safe than sorry...........lock your profits and scamper and focus on another trade!!
I thought you might say that 🙂
Still trying to get a wider view re: correlating indices, constituents.
Thanks, very useful, will have a look back and see what you saw.
watching trend line with immense interest .....
if breached along with S&P 933 level and DAX failing to stay above 5000 ...............
then FTSE will reach 4300 level easily