Cheers Rez, I guess its about what works for the individual. Still thinking about a short on FTSE?
im just thinking of a nice weekend now mate! 😉....but next week i think i'll be bearish...
Cheers Rez, I guess its about what works for the individual. Still thinking about a short on FTSE?
Good weekend every one
I am just reading through the blog before i'm off to cricket because i have missed a lot of posts
A round of applause to Mr Rezadamus...........:clap::clap::clap:
some impressive results
Hey everyone! I really should be enjoying the weekend, but I get caught up in my research sometimes! Does anyone know of a charting package (preferably free) where you can enter certain criteria for indicators and as a result buy/sell signals appear on the chart as a dot or a small triangle or something of this nature? Many thanks
http://www.marketwatch.com/news/story/More-US-swine-flu-cases/story.aspx?guid={87FFF5DA-8981-43C8-A23D-C7694FA1E770}
World Eyes Deadly Flu Risk, Mexico City Hushed - Economy * US * News * Story - CNBC.com
I am contemplating opening a few shorts on the travel and leisure sector index on my CMC account, what do you think chaps?
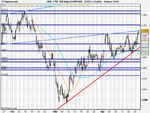
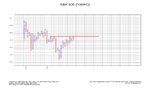
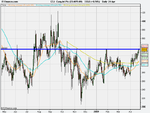
854 next possible support, but 850 will be a good buy as neck-tie with 50 & 20 MA on S&P
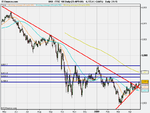
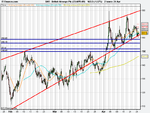
Oil holds the key - can it hold above $50........................it has already failed $51 level
formula
oil < $50 market fails to trade upto 4300 level and goes below 4000
oil > $50 ..........4300 is inevitable
financials will be weak come Monday morning and I will certainly be shorting them............
Mining sector is one to watch ...............if it shows weakness along with oil and banks then Iwill certainly open up the shorts
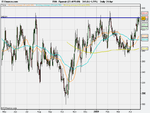
Anglo American is looking very top heavy ...............
goodnight
http://www.marketwatch.com/news/story/More-US-swine-flu-cases/story.aspx?guid={87FFF5DA-8981-43C8-A23D-C7694FA1E770}
World Eyes Deadly Flu Risk, Mexico City Hushed - Economy * US * News * Story - CNBC.com
I am contemplating opening a few shorts on the travel and leisure sector index on my CMC account, what do you think chaps?
hang seng fell 2% on flu worries.dont forget easyjet and ryanair