You are using an out of date browser. It may not display this or other websites correctly.
You should upgrade or use an alternative browser.
You should upgrade or use an alternative browser.
leovirgo
Senior member
- Messages
- 3,161
- Likes
- 156
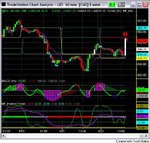
ive gone short 853.5 as per wallstreets thread. Stepping in front of a train but inesrestinfg area.
Good luck with your short mate. For me its switched to buy mode - there is white cross bar that prevents me from shorting. Lets call it white elephant.. lol..
Attachments
leovirgo
Senior member
- Messages
- 3,161
- Likes
- 156
My level stalled the rally but hasn't turned it as yet. May well stop me out. Your bias was correct again near the open where you said 'possible long entries'.
It 'should' test vwap. Or this rally may lost its leg and cycle could turn down.. give it some time. lets see..
About this long call, I wasn't sure when I first typing my update.. then I saw long opportunities in all indices. I missed the boat, wasn't quick enough to get in- but already have had long positions in stocks (RIMM, CTXS, ESRX, SYMC). All sold out when ES hit 853. Now I need a new entry. [And, not kicking myself but on the positive note, I must do the typing well before market open.]
Happy trading 🙂
leovirgo
Senior member
- Messages
- 3,161
- Likes
- 156
closing it here for a few points profit - Taking too long for my liking to really do anything. Probably crash without me now 😉
that was a quickie! cheers 😉
leovirgo
Senior member
- Messages
- 3,161
- Likes
- 156
CycleX bars
Now that I have some 'spare' time. I will post a little bit about white and grey bars a.k.a elephants due to their fat size on hourly chart.
White bars
I use them as long-bias. They occur in up cycles, when crossing up SR lines.
Grey bars (dedicated to Grey1, always thankful..)
For short bias - opposite of white bars.
Of course they are not holy grails but good enough to trade with personal style.
Enjoy my elephants of the Dow jungle..
Attachments
leovirgo
Senior member
- Messages
- 3,161
- Likes
- 156
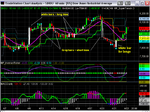
For me its switched to buy mode - there is white cross bar that prevents me from shorting. Lets call it white elephant.. lol..
I missed earlier upmove. But it produced white bars, so I've been patiently waiting for an entry. All I did was pick the best candidate for the day, i.e, ES to go long when it tested vwap again.
VE rocks again.. thank you sirs....🙂
Attachments
leovirgo
Senior member
- Messages
- 3,161
- Likes
- 156
pedro01
Guest
- Messages
- 1,058
- Likes
- 150
Equities index futures, EQX as I would call them, are very technical these days (except Monday's super fall). This environment must be good for all technical traders... 🙂
Looking good Leo !
It'd be interesting to see how this would perform with ze top secret basket trading module I have.
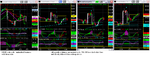
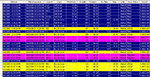
Attachment 1 - Here's a losing trade - or rather a short signal that triggered a short basket fill but the market went up (rejected orders are retries of orders not yet filled):
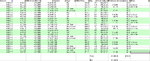
Attachment 2 - Details in Excel with P&L (wouldn't it be nice if all losing trades ended up like this ?)
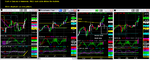
Attachment 3 - a nice day last week with 2 rather more friendly signals - a short in the morning & a long in the afternoon.
Would the 2 make beautiful music together ?
Attachments
Last edited:
leovirgo
Senior member
- Messages
- 3,161
- Likes
- 156
Would the 2 make beautiful music together ?
Hi Pete
Nice to hear from you and glad to see your module working well. I have no doubt in its capability - it will be a good executioner. As we've discussed before, I am still keen to develop a system. 🙂
My VE needs human input
I tried 100% mechanical version at lower TF and the results are mixed, as you've seen in my earlier posts. Cycle analysis alone is 50/50 or just abit more IMHO, although cycles at higher levels such as H1 are more reliable and/or use of good money mgmt will bring consistency in overall results. I use external factors such as Meanlines and market internals to increase the probability and thats where I can't code them into a mechanical system. That can be solved with human input as and when the assessment is updated, say input 1 for long only 2 for short , 3 for profit taking etc in the module and the engine will take care of smaller tasks. In summary VE needs a human CEO.
Top-down approach
Your approach (in fact it is Grey1's approach) is based on top-down nature, in which it tries to exploit the (small) movements of stocks that follow INDU's lead as headless chicken. It is a very good approach and it has been proven as profitable.
Stock selections
In my VE, I am testing stocks on the assumption that they are inter-connected with INDU. My finding so far is that there are 3 groups
1. leaders that lead INDU/SPX/NQ
2. majority that go together with indices
3. laggards or contrarians that are independent
If we want to use your module, I want to make sure that we pick middle group on a daily basis so that we achieve something like 70% hit rate. I know I am a perfectionist but that is where I want to achieve. I think we need Strong/Weak filter at H1 level, not just the current day's line up. Thats my personal opinion. We can definitely give it a try with what you've got.
So lets bring it on...😉
pedro01
Guest
- Messages
- 1,058
- Likes
- 150
When you were testing this and you had a relatively low hit rate, were you using Tradestation Strategies ? Were you also using multiple timeframes ?
If so - you need to be aware there is a massive flaw in the way that it handles multiple timeframes. Let's say you use the 60 minute MACCi in your code, whatever analysis you do based on the 60 minute MACCi will be an hour late.
So - lets say you use the fact that the MACCi is pointing down for confirmation. It can be pointing up for up to an hour before your strategy will know about it.
Check out my thread on the Tradestation Forum about this....
https://www.tradestation.com/Discussions/Topic.aspx?Topic_ID=86487
Of course - for every problem there's a solution :smart: - Just be aware that it is possible that your strategy may be good but this issue could be the reason for degradation of the results.
pedro01
Guest
- Messages
- 1,058
- Likes
- 150
Stock selections
In my VE, I am testing stocks on the assumption that they are inter-connected with INDU. My finding so far is that there are 3 groups
1. leaders that lead INDU/SPX/NQ
2. majority that go together with indices
3. laggards or contrarians that are independent
If we want to use your module, I want to make sure that we pick middle group on a daily basis so that we achieve something like 70% hit rate. I know I am a perfectionist but that is where I want to achieve. I think we need Strong/Weak filter at H1 level, not just the current day's line up. Thats my personal opinion. We can definitely give it a try with what you've got.
So lets bring it on...😉
I agree with that. You could have something that is negatively correlated on the day & if the DOW was moving down & you suddenly get a long signal, that would be one of your strongest stocks ! Not the best buy though.
At the moment, we are looking at building in correlation in addition to strength, we have a basic correlation algorithm in there but are looking at building in something a little smarter. 'Brains' has given me a 'simple' correlation algorithm but I can't make heads or tails of it & he's not well right now, so hopefully he'll enlighten me further when he's better !
leovirgo
Senior member
- Messages
- 3,161
- Likes
- 156
24th April pre-Market
Index futures are up. (Cable and gold are also up). Cycles are neutral so will either go long or short. INDU cash is in up cycle, could drive the markets.
Key levels
INDU cash : 7980
ES: 848
YM: 7930
NQ: 1345
Depending on how 60 is playing I will take position from these levels.
Index futures are up. (Cable and gold are also up). Cycles are neutral so will either go long or short. INDU cash is in up cycle, could drive the markets.
Key levels
INDU cash : 7980
ES: 848
YM: 7930
NQ: 1345
Depending on how 60 is playing I will take position from these levels.
Last edited:
leovirgo
Senior member
- Messages
- 3,161
- Likes
- 156
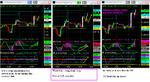
White elephants flying..!!
24th April Midday update
Cash cycle is driving all the equity futures. Had nice entries in YM and ES when they pulled back to vwaps. Now 60 cycles are all OB hence exit time.
Note that all of them, preceeded by White Cycle Cross Bars (aka white elephants), broke free from boxes formed by previous days' means. Thats why I can say white elephants are flying today...lol...
Have a nice weekend...coz I will. 🙂
Attachments
leovirgo
Senior member
- Messages
- 3,161
- Likes
- 156
Vwap Engine basics
VE has only three set ups.
1. Reversals : VE don't pick exact high/low but will pick lower high/higher low upon pullbacks to vwaps or taking positions upon vwap crossings.
2. Cycle Crossing Means: 60minutes bars crossing mean lines with cycles in the back.
3. 1WAY Trade : effectively trend trading. This setup happens when cycles are so strong that reversals are not expected, until proven otherwise, and hence attempting to take the trades in one direction. Again, entry is at vwap or near enough. Price discovery at new highs lows are expected with this set up.
From middle of March to early April, it was mostly 1WAY trade.
I have posted many charts that describe these three set ups. (Reversals are not that many, so I will post some later on.) Posting them has helped myself as a learning tool. If it is of any help to you then it is even better for me. 🙂 Please feel free to post here or pm me if you have any questions.
leovirgo
Senior member
- Messages
- 3,161
- Likes
- 156
When you were testing this and you had a relatively low hit rate, were you using Tradestation Strategies ? Were you also using multiple timeframes ?
If so - you need to be aware there is a massive flaw in the way that it handles multiple timeframes. Let's say you use the 60 minute MACCi in your code, whatever analysis you do based on the 60 minute MACCi will be an hour late.
I use multiple TF and GV in RadarScreens and it works fine. Its not late if intrabar analysis box is ticked at both GVsender and GVreceiver.
leovirgo
Senior member
- Messages
- 3,161
- Likes
- 156
Cycle analysis basics
Try using 60 > 10 > 3 minute cycles
How I read cycle direction from 60 minute bars
Cycle direction from 60minute is best read after the bar has closed. This is very important point. One might think ..oh this signal is an hour late and feel that up to the minute signal is better. Then you may be trapped in the pursuit of non-lagging indicators and you will never find it because, to me, even the price itself is lagged.
Price itself is lagged
How can that be? Because the price or 'last price' is the reported price where transactions have just taken place. So once it is reported as last price then it is already in the past. It may sound a bit philosophical but thats the basis for my cycle analysis. So, as a technical analyst, I am not after non-lagging indicator. Any oscillator that generally captures the highs/lows of a cycle will be fine.
Expected cycles
This is the most important part. Also, the key to understanding cycles lies here. Once a cycle is overbought, then prices should start to fall. If they don't, then it is trending. So the next logical entry is to go long. Also, if higher TF cycle is down, then short from lower TF o/b, once it is going down, ride it until it is oversold in higher TF. Ok, once 60 minute cycle is overbought, try shorting it when 10 is overbought 'again', not when they are overbought at the same time. You have to wait until 10 is overbought (again). How far will it go? Usually 1 ATR of higher TF (60 here). It is as simple as that.
This is 50% of my vwap engine.🙂
vwap engine basics is here in post #181. Combie the two then you have (Price action+ Cycles)
Similar threads
- Replies
- 0
- Views
- 3K
- Replies
- 1
- Views
- 3K