Best Thread Vwap Engine

The last piece of jigzaw

VE has one last component that can override any other conditions. It is the analysis of Market Internals. I have a separate threat about it. I am linking it here for easy reference. It is called Topdown Approach to trading $INDU and stocks. Hope it is as worthy as the other cent in my 2c contribution on t2w. :)
 
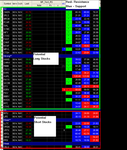
27th April stock list

This is the selection for today. I do not use basket approach, from this strong/weak list, I tend to pick the best that meets cycle criteria. This list comes from daily selection. So, intra-day selection needs to be done. (this is done by VE during market hours)

Usual legal stuff ( not sure if I need to do this as this is my own journal, anyway.. just to be safe )

Disclaimer:

I am not making any recommendation here, just posting what I am looking so if you want to trade, do it with your own discretion and judgement. I will not take any responsibility whatsoever.
 

Attachments

  • 090427 stock list.PNG
    090427 stock list.PNG
    48 KB · Views: 200
CSCO
CTXS
DTV
NVDA
QCOM
RIMM
AAPL

They are strong today. AAPL and ESRX are in 60 up cycle.
 
AAPL and ESRX are in 60 up cycle.

They are flying today... :) ESRX reached target and AAPL set as b/e.

On ES, VE took its first ever loss (since moving to 60tf) of 2.5pts ( set up failure exit, original stop was 4pts due to exceptional entry ). It was a short at 844. Now looking for a pullback to go long.
 
28th April

Long ES twice today. Been up for 5-6pts each time but the more greedy side of me didn't take profits and just set them as breakevens. Ended up paying commission.

Hard day to trade.. or it must have been me getting excited about month end.

I will not be trading for the next few days. Gotta move to a new place. See you all next month! :)

was the reason for you not catching the reversal into the close the internals?

looks like the cycles were lined up well and decent p.a to support this....

good luck with the move leo.
 
VE results for April (for YM,ES,NQ)

This is based on 60 minutes cycle. So not a lot of trades for the month. Average trade is 1 per day. I have moved this engine to a higher ground from M10/M3/tick to M60/M10/tick cycle structure.

Number of trades until 28th April

Win 8, Loss 1, breakeven 7 ( all had nice run-up )

(missed trade +1)

There are two more trading days left. I won't be trading for a few days - gonna be busy setting up my home office :)

Review

Strengths: Entry efficiency is very good as most of them go in favour straight away. High hit rate, if this rate can be maintained for long-term, I can consider smaller targets or scale out at pre-determined levels. Scale-in is not required.

Things to improve: How can I reduce break even trades? What if I don't set b/e.. will it affect overall hit rate or profitable exits? Will they become losers? Should I take addtional set-ups to increase turnover?

At the moment, it is an intraday system, taking trades during market hours and up until 30mins before market close.

Things to do: to review each and every trade and run back testing.
 
Last edited:
was the reason for you not catching the reversal into the close the internals?

looks like the cycles were lined up well and decent p.a to support this....

good luck with the move leo.

thanks..

Yes, it was a very tempting. At the moment, I trade during market hours less 30mins before close. Actually, I wanted to go long earlier today. Two things prevented me from doing so,..1) pre-market hours and 2) bearish internals (I guess the big boys have ways to cheat market participants even in this area, then it is of less important).
 
vwap indicator for tradestation

Hello Leo,

Can you tell me how to calculate the vwap line?

Thanks!

I've attached ELD file for TradeStation 8.5 version. It comprises of two parts

1. vwap_h (function)
2. mp_vwap (indicator)


vwap function is below.

//
vars:
PriceW(0),
ShareW(0),
Answer(0);

if date > date[1] then begin
PriceW = 0;
ShareW = 0;
end;

PriceW = PriceW + (AvgPrice * (UpTicks+DownTicks));
ShareW = ShareW + (UpTicks+DownTicks);

if ShareW > 0 then
Answer = PriceW / ShareW;

VWAP_H = Answer;

//
// vwap indicator is below//
//

inputs: UpColor(Magenta), DownColor(Magenta);

variables: upperMPD ( 0 ), lowerMPD ( 0 ), band ( 0 ),
HH ( 0 ), LL ( 0 ), Answer(0);

Answer = VWAP_H;

if AvgPrice >= Answer then
SetPlotColor(1,DownColor)
else
SetPlotColor(1,UpColor);


IF High > HighD(0) then
HH = High
else Begin HH = HighD(0);End;


IF Low < LowD(0) then
LL = Low
else Begin LL = LowD(0) ; End;

band = ( HH - LL )/ 2 ;


upperMPD = Answer + band ;
lowerMPD = Answer - band ;


IF Answer<>0 then BEGIN Plot1(Answer,"VWAP");
Plot2(upperMPD, "upperMPD" );
Plot3(lowerMPD, "lowerMPD" ) ;

END ;
 

Attachments

  • VWAP.ELD
    5.4 KB · Views: 272
This is based on 60 minutes cycle. So not a lot of trades for the month. Average trade is 1 per day. I have moved this engine to a higher ground from M10/M3/tick to M60/M10/tick cycle structure.

Number of trades until 28th April

Win 8, Loss 1, breakeven 7 ( all had nice run-up )

(missed trade +1)

There are two more trading days left. I won't be trading for a few days - gonna be busy setting up my home office :)

Review

Strengths: Entry efficiency is very good as most of them go in favour straight away. High hit rate, if this rate can be maintained for long-term, I can consider smaller targets or scale out at pre-determined levels. Scale-in is not required.

Things to improve: How can I reduce break even trades? What if I don't set b/e.. will it affect overall hit rate or profitable exits? Will they become losers? Should I take addtional set-ups to increase turnover?

At the moment, it is an intraday system, taking trades during market hours and up until 30mins before market close.

Things to do: to review each and every trade and run back testing.

For your break-even trades, you know what I'll say you should do - use the top down approach and trade a basket of stocks after a signal on the DOW. It would turn some of your b/e trades to winners. :LOL:

Trend is an interesting concept as oscillation at a higher timeframe is a trend in a lower timeframe. So if you want to know when the trend ends & you know what timeframe the trend is in, couldn't you just use normal trend ends price action ?

For instance you could try with trailing your stop losses at each cycle low on an uptrend. As you go through the cycle low, set the stop loss at the lowest low for that cycle. Your next cycle low should not hit that low if you are still trending up.

Conversely, you could get of a long out when price of a cycle high is not as high as the price of the last cycle high.

Tazatek has some indicators that plot cycle highs & lows, I wrote some myself too - but haven't looked at them for ages. See attached - let me know if you want the code - I can dig it out for you - it plots MACCi cycle high & cycle low prices. Not sure if it would do you any good though.

Your biggest challenge with adjusting this is in testing. As per my previous post, any backtesting in TS strategy code that uses multiple timeframes is invalid and will not produce the same results you will see in real time. It baffled me for a long time the way I could see signals being produced in real time when the market was open BUT when I ran the code against the same data the next day - the signals were different. As I said - a 60 minute MACCi will show you change of direction 1 hour after it turns.

So if the MACCi moves from heading up to heading down on the 60 minute timeframe, TS strategy code will still say it is heading up for the hour that it turned down.

Unless you work around that issue, you need to forward test every tweak to the system you make to get real results - which is a complete pain in the ass.
 

Attachments

  • WTF.GIF
    WTF.GIF
    20.3 KB · Views: 246
For your break-even trades, you know what I'll say you should do - use the top down approach and trade a basket of stocks after a signal on the DOW. It would turn some of your b/e trades to winners. :LOL:

Thanks for the ideas, Pedro. It requires a completely different risk:return assessment. They probably can be traded at ETF (entry time frame) alone. Cycle, stop and target can be calculated at ETF level. Again, stock selection is another important factor. I will pm you about how we can try this idea.

As it is, the results are based on trading index futures- at least half of them could be winners if I lowered the expected returns. However, as Paul said, I am not going to change it just for the sake of reducing b/e trades. It has 8 winners and 7 b/e trades. All those 15 trades were equally capable of catching a big trend. About half of them came back to entry point and thats fine. The system as it is now is already good enough. It doesn't have alot of trades to calculate statistically significant ratios but it went through April consolidation period. So I might get a different picture in another environment. It doesn't matter. It is part mechanical part discretion system. I will keep it as it is. My priority at the moment is to be consistent.


So if the MACCi moves from heading up to heading down on the 60 minute timeframe, TS strategy code will still say it is heading up for the hour that it turned down.

Again, I use cycle direction from last closed bar, not current H1 bar. So it never was a problem for me. Even if you are after exact reversal points, you don't need intra bar direction from hourly chart. Thats partly becasue I use Inverse Fisher in addition to MACCI. Like I said in my earlier posts, once I can read price action at multiple time frames, then I can do away with indicators, I hope! Or just keep them as long as they are profitable.. Happy trading :)
 
I think I have said enough about how it works. So from now on, I will write more about how 'I' try to be consistent and less about the mechanics of the VE itself. Therefore, it will be alittle bit more personal but I will try to keep fear and greed at minimum level. I must deal with them devils at this stage to move onto the next level.

So, the first attack on them will be .. not to change the system. I will be using this VE as it is for another six months. Fear and greed are kept at current level. No more no less.
 
Thanks for the ideas, Pedro. It requires a completely different risk:return assessment. They probably can be traded at ETF (entry time frame) alone. Cycle, stop and target can be calculated at ETF level. Again, stock selection is another important factor. I will pm you about how we can try this idea.

As it is, the results are based on trading index futures- at least half of them could be winners if I lowered the expected returns. However, as Paul said, I am not going to change it just for the sake of reducing b/e trades. It has 8 winners and 7 b/e trades. All those 15 trades were equally capable of catching a big trend. About half of them came back to entry point and thats fine. The system as it is now is already good enough. It doesn't have alot of trades to calculate statistically significant ratios but it went through April consolidation period. So I might get a different picture in another environment. It doesn't matter. It is part mechanical part discretion system. I will keep it as it is. My priority at the moment is to be consistent.

Best thing you can do is nothing then !!

Again, I use cycle direction from last closed bar, not current H1 bar. So it never was a problem for me. Even if you are after exact reversal points, you don't need intra bar direction from hourly chart. Thats partly becasue I use Inverse Fisher in addition to MACCI. Like I said in my earlier posts, once I can read price action at multiple time frames, then I can do away with indicators, I hope! Or just keep them as long as they are profitable.. Happy trading :)


OK - if you are specifically using if MACCi60min[1] > MACCi60Min[2] from the 60 min timeframe data in your code you'll be OK. If you are using MACCi60Min without the [barsback] - i.e. the current value of ANY indicator from a higher timeframe, then you will have the issue, although it is not something that manifests itself in any ovious way, although it does cause degradation, especially at times when indicators change direction.

The issue applies to ANY indicator from a higher time frame - moving averages, MACD - everything. The way they operate in backtest mode is not the way they operate when running live. It is a huge issue with TS that not many people have picked up on. Mostly because its quite a hard thing to wrap your head around.

As for Inverse Fisher - if that's at yout lowest timeframe you'll be OK - if it's from a higher timeframe and you are using current value, you won't be OK.

In terms of how much difference this made to me on a system using MACCi & some other cycle indicators - it made improvements of about 10% to the win rate.

The other thing you should consider is that if you are using TS strategy code & strategy commands, you should consider dumping them and use TS indicator code with embedded order macros instead. TS 8.6 now has OCO orders from macros too - so you can put your exit orders on when you place your trade.

There's also a system called "Strategy Runner" that I just signed up to which can act as a 'back end' to Tradestation - apart from having better order management, your TS orders will sit on their servers instead of your machine, so in the case where your system is running & there's a power failure, your exit orders are still guaranteed, unlike Tradestation which is a but flaky about when you orders move from your machine to their servers for execution.
 
Last edited:
May 6, 2009

Equity indices are toppy at the moment. Daily cycle is o/b so profit taking zone is here. If things turn to downside, there could be a tradable pullback to short. So far, for the last few days, it is constantly in buy mode, but NQ is showing exhaution with large down bars.

I am using mobile broadband (USB modem stick connected to PC) with no wires and proper internet. So, its slow at times, especially when the markets are volatile and so many ticks come in at the same time.
 
7th May

No trade for me today so far. Its one of those days when VE will watch the markets to sort themselves out for a better set up. Signs were already there yesterday with toppy price action.

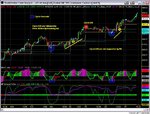
However, as I have some spare time, I am attaching VE analysis for the last few days. Its interesting to see how cycles work with mean lines, pushing the cycle up into a new level each day. Up cycles are followed by PA to a new level where down cycles are rejected and pushed back at previous days mean lines. There are many low risk entries to trade this market.
 

Attachments

  • Cylcle vs Price Action ES 090506.jpg
    Cylcle vs Price Action ES 090506.jpg
    140.2 KB · Views: 187
Hello leovirgo.

I've gone through all posts in the thread, and have really learned a lot.

But I can't figure out if you take a long trade on the CROSS above the VWAP, or when it is near the vwap (just under it). The opposite for short.

Also, when you mention MEAN, do you mean (no pun intended - hehe) average, or actual vwap. you have mentioned support at yesterdays mean, but I don't know if this is a moving average or yesterdays vwap.

Also, what are the values you use for MACCi? (what is that graph/line inside the macci histogram - another macci)? It looks like you are trading when the histogram is overbought/oversold and the other line is just about to turn...is that correct?

Thanks.

Thanks, and keep on commenting on your trades.
 
Hello leovirgo.

I've gone through all posts in the thread, and have really learned a lot.

I am glad it is helpful for others.

But I can't figure out if you take a long trade on the CROSS above the VWAP, or when it is near the vwap (just under it). The opposite for short.

It doesn't matter. Vwap is still an average so give or take 1ATR of the timeframe you are trading is still close enough, either above or below.

Also, when you mention MEAN, do you mean (no pun intended - hehe) average, or actual vwap. you have mentioned support at yesterdays mean, but I don't know if this is a moving average or yesterdays vwap.

It is yest vwap.

Also, what are the values you use for MACCi? (what is that graph/line inside the macci histogram - another macci)?

The line is MACCI fast 6/5. (CCI 6 period and simple MA 5 period) The histogram is MACCI slow. It is like you are watching MACCI of 4hr on 1hr chart. The settings depends on your personal choice. If you are new to MACCI or cycle analysis, stick to one cycle for the moment because it takes a while to get used to one cycle let alone two. Just multiply the cycle settings with timeframe multiplier. Say it is 3x for 1min, 3min, 10min and 30min cycles, then try it with 6x3 = 18 etc. I will not say what to use for slow settings its up to you to find suitable one that works for you. I use 6 because it is what Grey1(founder of TT thread) used and also for cash market there are 6.5hrs trading time, so it makes sense. Feel free to change 6/5 or any settings. As I said before, Stochastics or any oscillator should work. Just add Price Action with cycles. Then you'll see which cycles are tradable etc.

It looks like you are trading when the histogram is overbought/oversold and the other line is just about to turn...is that correct?

As for the entry, I always use lower TF for entry. Once there is o/b or o/s in higher TF, zoom into lower TF and just ride a cycle there, once you are in, come out to higher TF, and manage the trade from HTF. Personally, it is the hard part to manage the position, entry is simple.

have a nice day :)
 
Not sure if I understand this...:

The line is MACCI fast 6/5. (CCI 6 period and simple MA 5 period) The histogram is MACCI slow. It is like you are watching MACCI of 4hr on 1hr chart. The settings depends on your personal choice. If you are new to MACCI or cycle analysis, stick to one cycle for the moment because it takes a while to get used to one cycle let alone two. Just multiply the cycle settings with timeframe multiplier. Say it is 3x for 1min, 3min, 10min and 30min cycles, then try it with 6x3 = 18 etc. I will not say what to use for slow settings its up to you to find suitable one that works for you. I use 6 because it is what Grey1(founder of TT thread) used and also for cash market there are 6.5hrs trading time, so it makes sense. Feel free to change 6/5 or any settings. As I said before, Stochastics or any oscillator should work. Just add Price Action with cycles. Then you'll see which cycles are tradable etc.

If I am using the fast macci 6/5 for cycle settings, then for the 1 minute, I should use 6/5, then for the 3 min I should use 6*3/5*3, and 60min 6*30/5*30?

I'm not sure what the 3x multiplier is or where it comes from if this is not the case.
As for the entry, I always use lower TF for entry. Once there is o/b or o/s in higher TF, zoom into lower TF and just ride a cycle there, once you are in, come out to higher TF, and manage the trade from HTF. Personally, it is the hard part to manage the position, entry is simple.

So, if 60 min o/b, look for 3/10 min o/s to go long (with the 60 min trend)? or the opposite, we are looking for higher time frame overbought (60min), and lower timeframe overbought (3/10min) to short for the overbought condition to be releieved first by the shorter timeframe (3/10).

I'm pretty new so please ignore the ignorance :)

Also, who is grey1?

Thanks... and have a nice day.
 
Last edited:
Top