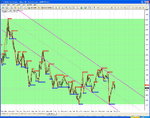
wasp: I was doing the same experiment. I am using 1-min bars to accelerate the points at which the slope changes.
However, if the trend is down, and you short in the upper zone, then arent you getting a good deal, unless its a rocketing move in opposite direction?
simply put -- YES !
rather than dismiss it out of hand, might be worth futher analysis, even with the repainting. But it sure makes back-testing an utter pain.
not a strong believer in back testing anyway, but i use what works and this works --- its really nothing more than trend lines, that will readjust (not the real repainting like zigzags though, and certainly not on the higher timeframes)
And yes, the channels resize dynamically, so you would still need some other method to give you a signal that the pull-back is complete. As per mps thoughts, s/r is as good as any method.
there are a couple of trend arrows and dynamic s+r arrows that help this whole thing tremendously --- when intraday trading, one reaches resistance and then a little arrow pops up above the price --- its telling us that once the price retraces off this high, goes down to the 23 fib (usual, except for the BIG one just before rollover) it will now go to the NEWER high shown by the arrow --- you can skip this and just set a trade by looking at the H1 chart and taking that high as your tp point, and then sit back on a longer trade. I use the H4 for "overnite" trades (means you guys -- the london open) and since forex moves to where it says it will move, my overnite trades come out very nicely, while i sleep !
i use one called "support and resistance" --- those THREE words have to be there, as there are many s+r overlays. but i have to maintain that the channels should not repaint onthe higher timeframes, which is where your "absolute" tops and botttoms live.
i have two charting systems and one repaints (mt4) and the other doesnt, UNLESS there is an awfully good reason to do so as the lines are simply measuring PRESENT support and resistance, based on past history of tops and bottoms, and therefore will depend on how far back youre looking.
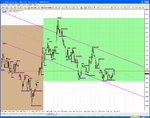
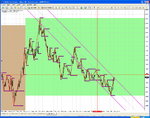
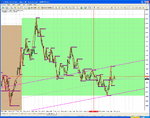
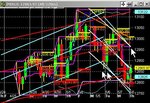
Notes on images; on the second pic, the red-line is where the second pic carries on from.
if you had shorted in the upper channel from the first pic, then you would still be trading in the correct direction.
if youre with the trend, you can do no wrong as the market will take you out of any bad trades (whatever a bad trade is !)
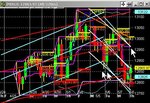
the purple markers are S_and_R indicator from some nerdy-geek called Chris, whoever he is! :
as you can see on attached chart, even though price spiked past the LRC, it didnt move the top because it was spike and not a close above the line, so the historic LRC holds.
are you using "SHI_CHANNELS_REAL" ??
ALSO, what does "cheesy" mean ?
cheesy:


