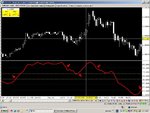
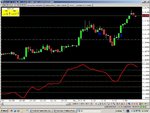
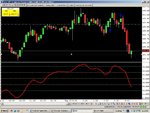
10 Min EUR Chart

Well I have come to the conclusion that this method is not really working for me the way I want it to. Consistency is an issue, where I am getting whipped around a fair bit in flattish markets. Don't get me wrong, it did produce some good trades, but I'm not that comfortable trading it, as exits are still an issue for me.

Having said all that, I have been working on something else that uses 5 min charts. Still working on it, and it is a little different using horizontal lines on a Stoch. I'll keep to myself for now and give it a bit of live testing before I start spruiking about it.

Thanks to those members that took an interest in this thread and hopefully I can contribute further in this trading community. Cheers.


Thats too bad it didnt work out :(
but i hope that new method will! :) Post it when you feel comfortable with it later :)
Cheers
 
Hey guys, been playing with different set ups and think Imay have come up with something worthwhile. Still on the 10 min charts (CMS VT). Looking a the EUR, JPY and CHF just add a few more trades to the mix. Nice and low spreads on Oanda on these three also, with EUR at 0.9, CHF at 1.9 and JPY at 1.6.

I am still aware of any major news releases relating to the traded pairs, and also use the daily pivot lines to give me an idea of where price is. Still also looking for 10 - 20 pips per day and then calling it quits. My trading also starts around the UK open which is around 4pm local for me. Ideally I want to be in bed at a decent hour.

My indicator of choice is the Stochastic Oscillator (Slow) with the settings 75,4,4. No idea how Icame up with these settings, but they seem to work out okay. I only have the %K line highlighted, leaving the %D line the same colour as the background. I have then marked the following horizontal lines on the stoch at 20, 35, 50, 65 and 80.

Simple so far...

Now I am looking for the squiggly line on the stoch to cut through the horizontal lines to give me entry. I will send screen shots of what I mean in the very near future, but not tonight as I am feeling a little poorly. To try and explain it, if say the line was heading down through the 50, 35 and 20 horizontal lines, and then turns back up through the 20, once the candle that confirms the cross closes, I would enter a buy on the open of the next candle. This trade would be held until I am either happy with my profit or the line turns back down through one of the horizontal lines. I would be looking at a safety stop of about 30pts, but that would rarely be used.

That's the jist of it for now. Will give anyone that is interested something to play with. A bit more of an explanation will be given tomorrow. Cheers.
 
Okay guys here is a picture to help you too see exactly what I am talking about. Have a look at the stoch below the chart and the arrows show a new entry point. I want to confirm that the stoch has changed direction by cutting up through a new horizontal line from the opposite direction.

I normally wait until the close of the candle and enter on the open of the new candle, but if there has been a big move and only a couple of minutes to go, you may consider jumping in sooner.

This chart is probably a little cherry picked as I wanted to show some clean moves just to clearly show the idea involved.

I will attempt to post some real time trades this week to explain things a little clearer, but this should be enough to get anyone that is interested, a heads up on where I am coming from. Cheers.
 

Attachments

  • EUR.JPG
    EUR.JPG
    118.7 KB · Views: 173
Okay let's have a look at todays trades for Wed 3rd Sept. The problem being the CHF and JPY went a little early for me, but did manage to jump on the EUR. I like to start my trading anytime after 4pm local which is 2am on my VT charts (NY time).

But I will cover the early signals just to show you what I mean. There are a number of horizontal lines drawn on the charts and these represent the daily pivot lines, with the aqua one being the main pivot line, the white ones being mid pivots, the green ones are resistance and the red ones are support levels.

I'll start with the CHF. Banged its head on resistance with the stoch turning down from above the 80 line. New sell signal generated on the open of the 1.40am candle at 1.1115. It did go against me initially up to 1.1128 (-13) but the stoch remained below the 80 line, where eventually price dropped down nicely to the 1.1081 level (+34) which would have been more than enough for me.

The JPY also had the stoch come down from above the 80 line with a new sell signal generated on the open of the 1.50am candle at 108.92. Bounced around a little on the mid pivot line and then began to drop, hitting the 108.74 level (+18) before pulling back. Again, some pips to be made here.

The EUR was bouncing around a mid pivot line and coming up from below the stoch 20 line, generating a new buy signal on the open of the 2am candle at 1.4430. This went up just past the support pivot to the 1.4467 level (+37) before pulling back.

Again, enough pips for me to call it quits for the day, especaially as all three trades would have been open at the same time, hence a decent total of pips considering I am only after about 20 for the day.

As I type this, the EUR has just gone into a sell signal on the open of the 3.10am candle at 1.4445. The stoch had just gone above the 35 line and then turned down. Whether it holds or not, I don't know as yet.

All entry points marked by the blue arrows on the chart. Cheers.
 

Attachments

  • 3rd Sep 1.JPG
    3rd Sep 1.JPG
    314 KB · Views: 178
Sorry guys, just checked my image and it wasn't that easy to see because it included my other monitor on my desktop. I'll change to my laptop and show each chart in full on further updates. Oops. The right hand monitor shot is of some software I use to trade FX also. I track the same three pairs on the timeframe just to see how it compares. For info only at this time. Cheers.
 
CHF update. New long signal generated on the open of the 3.30am candle at 1.1113 which went up nicely to the 1.1169 level (+56) before pulling back. This was around a mid pivot level after b reaking up through the resistance level. That would definitely be enough for the day...Cheers.
 

Attachments

  • chf.JPG
    chf.JPG
    119.7 KB · Views: 200
JPY Update.

A bit messy this one but still doing okay. There was a new buy signal generated on the open of the 3.20am candle at 106.91. One candle later it reached a high of 109.08 (+17) before pulling back. At least 10 pips there.

The stoch then rolled back down through the 80 level giving a new sell signal on the open of the 4.10am candle at 108.91. Went against me initially by about 8pts before turning down nicely hiting the main pivot line at 108.51 (+40). Again a good result and technically still open. Cheers.
 

Attachments

  • jpy.JPG
    jpy.JPG
    121 KB · Views: 164
EUR update.

The last EUR post mentioned I had gone short at the open of the 3.10am candle at 1.4445. There was an initial pullback of -9pts before turning down nicely, heading down to the 1.4390 level (+55) before pulling back somewhat. Plenty of pips there also. Technically still in the short, but why would you bother.

Hope this is all a bit clearer now on how this method works. There is just about always a good move one way around the UK open. No need to get greedy, just grab the 10-20pips and get out of Dodge. Remember, we are only on a 10min chart. Cheers.
 
Just a snappy update on what happened later.

The CHF had 2x 20 pip losses in succession followed by a big 100 pip winner that would have more than made upf or the losses. The EUR had a new long on the open of the 7.30am candle at 1.4430 that went to +60 before pulling back. JPY wasn't so kind as it just seemed to bounce around for a while with no major moves. Probably would have taken a few small losses.

Keep in mind, I would have more than likely have been done trading for the day well and truly early in the day. It doesn't take many pips for me to be happy! Cheers.
 
Thurs trading recap.

Bit of a mixed bag really with plenty of trades on the EUR & CHF. JPY was very kind to me.

EUR:
Buy at 2.10 with a high of +16pts
Sell at 3.00 Loss of -24pts
Buy at 3.30 with a high of +25pts
Sell at 4.40 but only went to +12pts
Buy at 6.10 Loss of -18pts
Sell at 6.20 with a high of +48pts

CHF:
Sell at 2.10 with a high of +18pts
Buy at 3.00 Loss of -29pts
Sell at 3.40 Loss of -16pts
Buy at 4.20 with a high of +19pts
Sell at 5.50 Loss -18pts
Buy at 6.20 with a high of +60pts

JPY:
Buy at 3.00 with a high of +49pts
Sell at 6.00 with a high of +37pts

I then sat aside before major news which came at 8.15 and 8.30. There were certainly some very good trades after the dust had settled. Cheers.
 
Friday trading:

Nothing yet on the EUR but very close to going short.

JPY had a buy right on the 2am candle open at 106.59, which went to 107.00 (+41) before heading down. New sell signal on the open of the 3.30 candle at 106.72, with price currently at 106.29 (+43) and still open.

CHF had a buy signal on the open of the 2.40 candle at 1.1108, and still going up at 1.1152 (+44) as I type this.

Big news tonight with the Non Farm Payrolls, so probably not a great night to trade, but should be a bit of action after the release. Cheers.
 
Further Friday update about 30 mins before NFP news.

EUR had the sell trade on the open of the 4.40 candle at 1.4251 which had a low of 1.4219 (+32) before pulling back, but technically remained in a short hitting a final low of 1.4197 (+54) before turning up. The buy signal came on the open of the 7.40 candle at 1.4236, and up around +20 whilst typing.

JPY still has the same short open and going sideways.

CHF had a high on the above mentioned long of 1.1159 (+51) before turning down. There was a sell signal on the open of the 5.40 candle at 1.1138, but this didn't last long with a new buy signal on the open of the 6.00 candle at 1.1149, resulting in a loss of -11pts. This long hit a high of 1.1175 (+26) before turning down. There was then a new sell signal at the open of the 7.40 candle at 1.1145, which is at break even as I type.

20 mins until the news now. Probably a good time to tighten stops or get out all together. Cheers.
 
Top