Trading the SPX

Diamond Pattern forming in SPX?

Still some bullish astrocycles ahead into March 11 and April 14
 

Attachments

  • Diamond.PNG
    Diamond.PNG
    22 KB · Views: 198
Last edited:
Still carn't rule this out while its above that key 1361 level....

(Posted a similar chart on the Dow thread with a bit more explanation)
 

Attachments

  • bullspx.jpg
    bullspx.jpg
    187.5 KB · Views: 221
I think the bears are gonna get a major surprise here.

SPX could retest the old highs of the 1460's into March 11.......the next Delta Matrix ITD point.
 
Is that your own delta order Buy the Dips :?:

That March window on the higher delta frames is an MTD low & a seasonal 18 point long term delta low point...I don't have it has a high..
 
Current MTD high window is still open and could extend into mid-March

Current ITD is on a low IBP point due now (Hurst 2.5 week low)

I can only conclude next week is bullish.....and if SPX is in a diamond pattern, we could see a double top in the SPX back in the 1460's.....similar double top also happened in 1987


(yep, this is my own delta order of 11 ITD points)
 
They must be your own or part of the mainstream wilder points....:)

Nice to see you posting though :)
 
Bez......the Hurst 20 week low hits around March 19......maybe thats what your MTD is picking up.

SPX is starting to rally here......you feel confident about your Delta points :?: :)
 
I'd said it will rally to Monday a few pages back :)

Then we need a re-test ....;)
 
Here is my Delta count......currently sitting on IBP point (11) launchpad

If big moves occur around point #1......could see rally
 

Attachments

  • delta.PNG
    delta.PNG
    6.9 KB · Views: 183
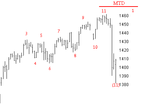
Ok thats not the order I use, but even with yours how can you say the higher frames ie MTD have not come in when the inter lows have all been broken...remember the rules :!:

If a lower delta frame low is broken when the trend is down, it means only on thing, a higher frame is in play...I don't know if your aware of the rule about 4 highs, but its void on your order because of the break of the inter lows.:)

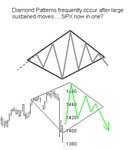
The Delta time frame below the Inter is saying up, but only till Monday....Then its a re-test :)
If it rallies beyond Monday then yes the odds favour the Inter is in, but at the Moment it does not...
 
All the crash people are out in full force. Prechter, Arch Crawford etc......thats why I suspect some more rallies....possible new high.

Matrix rules have broken before, may happen here.

Lets see what happens.
 
I've never seen the delta rules be broken once you have your roation correct :)

I'm not on about Copans CD;s which them selfs are not accurate and were "fitted" to complement the original Wilder stuff..

Thats not to say Copan doesn't know the score, its just what was put out for general consumption ..;)

I'm not disagreeing with you about upside as that elliott wave chart of mine shows... ;)

:)
 
Atilla said:
The dam has been breached.

I'm short from 85.

According to my fib 61% retracement this is likely to trail all the way down to 1315-20. If this is as significant correction as talked about I think it will exceed th 50% levels. In fact it could go all the way to 100% - 1250 areas.
I find this interesting, www.nisoncandles.com/nisonmarketupdate/nisonmarketupdate.html
after tomorrows closing one shall no a bit more. :)
 
Here's my take on recent events.......the action is v.similar to the rally and tank of last year (see chart). we've had new highs on major quadruple daily bearish divs, followed by a swift retrace to the vicinity of the low between the 1st and 2nd peaks (circled). Note how the 1st phase fall in may 06 is about where we bounced from today, 85 pts approx (pink). We've also had the volatility pick up, which has been normal for retraces in this bull market.

If we are still in the same type of bull market expect a expanded range downtrend to last for approx 2 months ( comprised of a reaction rally followed by new lows of no less than 1340 ish, which will be approx where the monthly value zone will be by then, see chart I posted a few days ago). thereafter a return to the low volatility uptrend (ie. 0.6% - 0.9% daily range) and new highs.

But there is plenty to suggest recent action is the start of new market dynamics and a break fron "normal" condtions. ie severity of gap, volatility expansion & speed of the decline.....which are in line with 2000-02 bear market conditions or expanded range uptrend (1997-2000). As it stands I am still in the "normal market" bull camp until we deviate from the above paragraph. Either way, the volatility is great news for traders.......enjoy it :)

esd_daily.gif
 
ajaskey said:
I still like March 9-12 as a bottom and a start of a 90 to 135 day run.

There is a chorus of respectable forecasters out there are also mentioning that March 9-12 area as a bottom.

I have March 9-12 as a top.....dont know if that is good or bad yet for me being the lone bullish voice :)

It definitely looks like a tradeable turn.....March 9-12 has two significant Spiral Calendar measurements from 2005 and 2006 winter solstice areas.
 
Buy The Dips said:
There is a chorus of respectable forecasters out there are also mentioning that March 9-12 area as a bottom.

I have March 9-12 as a top.....dont know if that is good or bad yet for me being the lone bullish voice :)

It definitely looks like a tradeable turn.....March 9-12 has two significant Spiral Calendar measurements from 2005 and 2006 winter solstice areas.


I've been away from the screens for most of today but what a week. I feel my loss the other day could have been avoided if I stuck with my position and rode out the volatility swings. Makes the pain of losing money worse because it's something that could have been avoided. To compensate I now have to dish out more money on my shrink :LOL: :devilish: :cry: :rolleyes: :confused: (Sorry clicking on these fuddy duddy faces is like therapy... :cheesy:

It's like you know the markets should sink further and they rise. Not sure what's changed since yesterday but we are back below 1390 to me which is significant.

I don't know about a bottom to this market but we are going down to 1320 levels to 61.8% retracement imo.

At the moment I'm listening to Bloomberg and apparently some people are saying don't exit just yet. Well I feel 95% confident this market has a long way to go down. The question is over what period of time. I'd say all the way through summer until August/September pickup time.

I've shorted SPX again at 1389.3. This time it will take a move above 1460 for me to close my position.
 

Attachments

  • SPX-2Mar07.gif
    SPX-2Mar07.gif
    30.3 KB · Views: 185
Top