Trading the SPX

  • Thread starter Thread starter wasp
  • Start date Start date
  • Watchers Watchers 82
Bez said:
I just use my own take on delta on where time pressure is likely to be up or down...😱

I wouldn't trade off it alone its just nice when everything lines up from time to time 🙂
I was just playing around on the 60min charts that hinted at a low point in time between 17:00 & 18:00 GMT...If things start to slip I can adjust what the higher frame is up too...

Is it worth buying that delta book or another which you might recommend? At the moment I'm just utilising text book theory and it seems to be working out ok.

I've had to run some errands so I missed the re-entry as I was thinking of shorting it but it seems to be pretty much at target of 1445.

The last several days the trading pattern has been almost identical. BBands bunch up, price breaks out downwards. MAs follow. Oscillators indicate extension and the S&P bounces. I noticed we didnt' touch 1460 today though.

Markets snoozing till tomorrow for the big one.
 
As you know I'm not really a fan of the book as most of it is inaccurate and curve fitted to the wilder standard deviation method, which lets say, a few director's 😉 disagree with.

Delta is the only method I know of that will give you an indication of directional pressure, from minuets right upto yearly time frames, it works very well with basic elliott as they are both fib based. The old saying is the fibs are set, the waves just follow....

The book its self gives a basic overview of the main time frames of the short ,Inter, medium, long & super long.If you want to get into delta then yes the books a good place to start....

Peddler tom ...oops I mean tradertom...🙂)) normally sells the book at a discount & they come up all the time on ebay. There are also tons of PDF's knocking around of it, so some kind sole on here might "lend" you a copy..😉 🙂))
 
I was a little lazy with the delta yesterday & today as I only worked out the hourly time frame, which gave the 17:00-18:00 bar, you can take it right down to the sub 5mins but its a very time consuming process & its much easier to use basic price & vol action with in the larger 60min frame to get a good idea of when the turn has come in...
 
Bez said:
I was a little lazy with the delta yesterday & today as I only worked out the hourly time frame, which gave the 17:00-18:00 bar, you can take it right down to the sub 5mins but its a very time consuming process & its much easier to use basic price & vol action with in the larger 60min frame to get a good idea of when the turn has come in...


Well if the US market doesn't pull out of this down turn this afternoon, as well as the change in possible trend is it possible that Chineese markets begin to lead the US? Is this the dog wagging the tail or the tail bitch slapping?

It's all in the data. Holding my breath on this one.
 
Interesting day ahead- the fut. is below 1445.. european mkts mostly down. Let's see if they buy the dip @ 1440 this morning. So, is the rally over?
good trades,
Andre
 
Mr_Stochastyk said:
Interesting day ahead- the fut. is below 1445.. european mkts mostly down. Let's see if they buy the dip @ 1440 this morning. So, is the rally over?
good trades,
Andre

If durable goods sales our down, I'd bet home sales are down too.

I'm long on GBPUSD

I suspect pressure is likely to be off on inflation & interest rates so SPX or DOW may rally. But the markets can be an ass and if the economy slow down weighs on traders minds it could fall lower (which is what I would guestimate).

I'm tempted to place bets with tight stops just before the news.
 
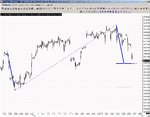
Key area on the Globex.....that 1440 area...

opps forgot to lable the 61.8% at 1438 as well....
 

Attachments

  • globex.jpg
    globex.jpg
    204 KB · Views: 149
Last edited:
Bez said:
Key area on the Globex.....that 1440 area...

opps forgot to lable the 61.8% at 1438 as well....

I'm sorry Bez, but what does this mean?

Global Exchange is that like an index of currencies?
 
Globex is part of the CMC exchange...
http://www.cme.com/trading/get/abt/index21430.html
the chart is of the emini s&p500 to try and get an idea on how the the Opening range will behave around normal technical levels..Ie hook sell or a hook buy on the 3min opening range bar.🙂

If people are using bookies, their SPX "price" is generated from the emini so people should just chart the emini price to see how the bookies get there SPX price..

Or like me you could just use a direct access broker.... out 😱 :cheesy:
 
Last edited:
Interestingly the delta hints at a low in the first 20mins then up till at least lunch 😱 :?:

hmmm seems like we have a throw over point..This is its last chance to go up, if it breaks the 16.30 bar low, then it will be a trand day down.... 😱
 
Last edited:
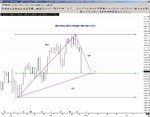
Not seen one of these for a while...

A price triangle into a 61.8%....

Normally these are rock solid TA support points but seen as today is a "margin call" based day I'm far more cautious than normal...

Just a ref post......
 

Attachments

  • interesting.jpg
    interesting.jpg
    198.5 KB · Views: 180
1400-01 would be 1/4 of the summer surge......
I'm looking for near to 1400 +/- eventually........ (potentially)
 
I'm expecting a drop followed by a bounce...

Perhaps the drop will not be as yesterday?

I think the price seems to be in a 1410 - 1390 range? Will watch to ensure it bounces of support and resistance and move in much later.
 
"a drop followed by a bounce..." this is a sentence at highest level esp. for trader

1434 : SPX is rising sharply
1437 : a stock market rally started euro is selling off
1439 : gold is selling off
 
Last edited:
I'd like it the other way round 😱

A bump up till in the first hour then the selling to start to kick again...
 
pssonice said:
1434 : SPX is rising sharply


Well the last 5 6 trading days the SPX has been almost spot on. Yesterday it fell and splat. 😆 Oh dear. 🙄

I suspect it will trend sideways in that range whilst all the traders watch each other. We need direction from uncle Ben, some good news and a little hope... 🙂
 
Back
Top