Trading the SPX

Briefing, com The yield curve remains in inverted territory with debate starting as to what it all means once Bernanke starts spilling his thoughts before 2 congressional committees. The inversion though has seen a move steeper as unwinds take out the deepest inversion levels since 2000.
 
trend reversal with test of the break or bye bye bears?
 
Last edited:
A mixed picture. Dow almost leading out of a rectangle BO, SPX and COMP still locked in bull flag/ triangle type patterns but looking bullish, NYSE ex-channel H&S forming, SOX just below formidable weekly res.

Racer - I'll plump for: S&P weak bull flag that will BO and be good for 1300. Meanwhile Dow will make 11220 and Naz 2350 (probably next week after expiry close of 11k Dow).

Then we enjoy a savage reversal good for 50 S&P points.;)

I wish. :rolleyes:
 

Attachments

  • untitled.JPG
    untitled.JPG
    309.9 KB · Views: 188
Briefing.com

The core (which excludes food and energy) Producer Price Index rose 0.4% in January. That was double the anticipated increase, and it breaks the trend of low figures. Following Fed Chairman Bernanke's assertion that monetary policy decisions will be increasingly dependent on incoming data, the sense that the PPI pop may signal a firming trend raises interest rate concerns.


The 2-10-yr yield spread ended the week near its most inverted level since Dec 2000 at -12.4 while the 2-30-yr yield spread tilted to -15.6 from about -12.6 a level last seen in Nov 2000.
 
Last edited:
Market says, "not so fast, bears"... Today equilized yesterday and we are getting overbought and not going anywhere. SPX1296 is a natural square of 36 which is a natural square of 6.

Looking back to 5-25-625 in 1996, the market hung around that level from Feb-Sept.

Looking back at 4-16-256 circa 1986-87, the market was volitile but took 2 years to finally make it through and stick...
 
Last edited:
Waitin' on the Fed

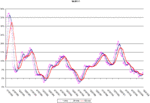
MZM growth is lame. When the Fed turns on the money spigot the market will go to the moon tout de suite. The move down to kick the Fed in the ass could be triggered by a quick rise in bond yields (oops, where's my conundrum?) and a dumping of stocks for easy money in the bond market.

Anyone want to play with more data can get it from here http://research.stlouisfed.org/fred2/categories/24
 

Attachments

  • MZM_030406.GIF
    MZM_030406.GIF
    13.6 KB · Views: 168
Last edited:
SPX COTS Commercials

The SPX COTS commercials are very short and the small specs are very long. SPX is ready to make time for it's date with despair. The relative positions should switch somewhere between here and 1168 where the pros bought them last fall.
 
SPX Roadmap

April 20th looks to be a significant date.
 

Attachments

  • SPX_Roadmap.GIF
    SPX_Roadmap.GIF
    60.6 KB · Views: 236
  • SPX_Cycle.GIF
    SPX_Cycle.GIF
    52 KB · Views: 227
Time Square

The move from April 20, 2005 to Oct 13, 2005 was 176 days (move up and down).

The subsequent move from Oct 13, 2005 to last Friday April 7, 2006 was 176 days.

The range of the move from April to April is 175 points.

My hope was that we would square out last Friday after a down move. Now we may need 90 days down before we can start a new up move - unless we get lucky with a mini-crash in the next 2-3 weeks.
 
Last edited:
Moment of Truth?

ajaskey said:
April 20th looks to be a significant date.

I was worried about 180 days up but really it was 90 up and 90 flat.
 

Attachments

  • SPX_Roadmap.GIF
    SPX_Roadmap.GIF
    64.4 KB · Views: 209
ajaskey said:
I was worried about 180 days up but really it was 90 up and 90 flat.

Down on the 13wk low point.
 

Attachments

  • SPX_13wk_Cycle.GIF
    SPX_13wk_Cycle.GIF
    49.2 KB · Views: 228
Joules MM1 said:
SPX hits initial target yet indistinct pattern upward and lacks volume....so far

A weaker low down to 1298 would set the scene for a stronger rejection back up. For now I assumming the low is in for this degree.
Hi Joules - are you still short at 1314 or have you closed it out ?
 
Square of the Bear Range

Just something to frame for the den.... :cool:
 

Attachments

  • spx_range_square2.gif
    spx_range_square2.gif
    40.9 KB · Views: 205
Last edited:
Slope of the Bear

Top line is the slope of the bear market - one point per 1.18 days. Bottom line is one point per 2.36 days.
 

Attachments

  • SPX_Slope_Of_Bear.GIF
    SPX_Slope_Of_Bear.GIF
    20.1 KB · Views: 170
Hi Joules - You still short the Dow at 11452 ?
If so, then why not the SPX too !
 
Top