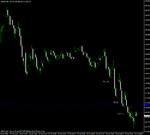
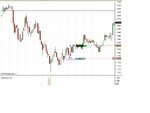
Here is a chart of the cable H1 trade I took a few days ago. I have slightly modified it from the actual trade I took to include a set-up I had missed as it formed coming out of the Asian session and I was asleep. Each 'T' represents a trade and each 'S' represents the trailing stop. For the sake of the thread I am using 2% as my risk.
View attachment 66132
Entries and exits as follows:
T1 - Entry 5941
Stop 5856 (Risk 85 pips = 2%)
Exit 6029
Gain = 88 pips / 1.04 x risk / +2.07%
T2 - Entry 5976
Stop 5927 (Risk 49 pips = 2%)
Exit 6029
Gain = 53 pips / 1.08 x risk / +2.16%
T3 - Entry 6018
Stop 5970 (Risk 48 pips = 2%)
Exit 6029
Gain = 11 pips / 0.23 x risk / +0.46%
T4 - Entry 6078
Stop 6008 (Risk 70 pips = 2%)
Exit 6029
Loss = -49 pips / -0.70 x risk / -1.40%
Total net gain +3.29%
OK - so not a great return but, as was pointed out to me at the time, I exited way too late as I ignored the weakness at what became the top of the move (aroung 1.61). If I had been more aggressive and moved my stops to my T4 break even level then the return would have been just under 5 times risk or 10%.
This is why I am happy to sometimes just close my M5 trades and walk away, as I have identified my financial needs (return I would like get get on my capital risk), and don't want / need any more.
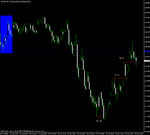
And finally, here's a chart from a few weeks ago. I had had a tough week and it had taken 24 entries since the Monday to get in on this runner.
View attachment 66134
Anyone trading cable will probably remember what happened next. Was I upset? Well obviously a little as, if I had held on to my shorts, the move would have left me about 70% up on my account but, to be honest, I was tired, stressed out by a tough week, and just wanted to take my money and run
🙂


