The Diary Of Not Even Semi-Serious DAX30 DayTader

Status
Not open for further replies.
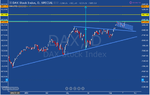
I posted my daily chart yesterday and comments for a push to 8800, then 9,000 and then eventually up around 9,500, though the latter 2 levels are my view over a few months.

This is my updated daily chart showing my projection of the chart pattern breakout (light blue arrows), there are of course resistance levels in between the ones I have indicated, but those are the major ones. The rest of the resistance will be on my daily S&R's I post when needed.
 

Attachments

  • daxdaily.png
    daxdaily.png
    43.8 KB · Views: 204
Just the one trade for me today due to being very tired and the U.S holiday.

Back in the market tomorrow.
 
Am in me bed on the iPhone, that's why it's a sideways chart, don't know what up with me, been feelin nackered past 2 days, I mean its no like I'm a party animal.
 

Cheers ffsear, £150 from bed on the wake up call,using the iPhone, same time tomorrow?

Seriously though, heading down stairs now to my trading screens, I have a long journey ahead, at least a 60 second walk!!!
 

Attachments

  • image.jpg
    image.jpg
    76.5 KB · Views: 138
Today's levels -

Support - 8705/15, 8690, 8678, 8650/65, 8645 (seem to be all tight together today)

Resistance -
8773, 8795/00, 8838, 8860/65, 8900
 
8675 is the positive/negative line today, retracements that hold above here to be bought when buy signals appear. Below 8675 deeper correction likely to 8500.
 
looks like dax really to fly through 8770

Just be aware that every man and his dog can see the current up-trend, which normally leads to an eventual shake out when the gravy bullish bus gets to full. Need to loose some passengers normally when this happens.

Also be aware that the EUROSTOXX is diverging with lower highs, lower lows just now on the 15 minute chart compared to the DAX higher highs higher lows. STOXX normally leads.

Things to think about before making a decision to buy into highs.

But trend is obviously UP, I would like to see some sort of pullback though as I feel a little dizzy up here.

Shall go with the flow though, the market is no place for stubborn biases.
 
Last edited:
The 1HR chart is showing resistance to the high dating back to 19/9. Ideally a healthy push-test-continuation will give more strength to the bulls.

However, if prices flail around this area with a few failed breakouts we could be seeing the start of distribution. We are into new high ground above here (8770+). Psychologically an important area.
 
Status
Not open for further replies.
Top