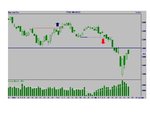
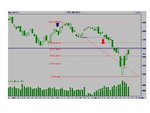
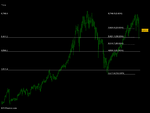
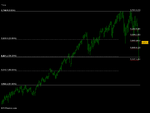
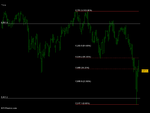
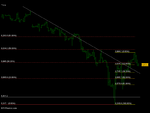
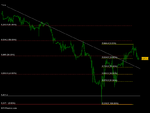
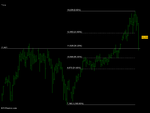
Normal Pivot points work well IMO
Thinking about a suitable chart style to visualise anticipated 'morning after' catch-up action by FTSE with Dow/S&P trading after London close. I suppose a simple 2-3 day candlestick chart might be the minimum design required, with catch-up section highlighted. Theory is that if we can see (or anticipate) the US candlestick pattern we can see what FTSE needs to do to convert from what it looked like on closing to match NY asap after its re-opening. Anyone doing this already though?
Hi tomorton
In normal market conditions
😆
Normal Pivot points work well IMO, just couple"d with location to wk H or L day H or L, you get pretty good judging where they should be, or if/when a move starts, where its going to etc
Very often good trades just jump off the page at you (in balences between the 2 indexs) usually the Ftse is the wrong side = thats where its reputation for being more range bound comes from IMO (2 days in every 1)
Next day Dow Fut are suportive but how hard are they traded pre-market ? if they are strong I am looking to Short and vice versa depending on Index position/location
I do not use the pivot points on there own to trade off just a sort of map to see where we are and compare
The ftse just overreacts to everything IMO and pivots highlight this because they are based of fixed ref points
H L and C, you can include O if you want, but I don"t bother
I find they help anyway, but have used them for ages.
Using Pivot Points for Predictions
hope above helps, you would need to watch for a week or two in more normal trading conditions in order to make your mind up and have a chance of seeing the benefit
dont do candles so .....

