swingin' the ftse: 2008

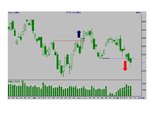
...and today's close was below the earlier swing low which lit the second warning light and left most chalking in a swing trend change to down and looking for a short after the first reaction. Some will have already entered short on the break, yet others will want further confirmation of the change before commiting themslves.

good trading

jon
 
Small long from yesterday stopped out - again. Dived in long on FTSE this evening after close as Dow currently showing an up day and FTSE likely to follow overnight / first thing tomorrow: looking for limited gain only, with possibility of going long again if London clears 6314 in trading hours. Nothing ventured.....
 
Following the thread with interest. Won't add to much however. The 1 minute time frame I use bears no significance to what you guys are discussing. Keep up the good work
 
Also following with interest.

For what its worth my FTSE charts (from Sharescope data) give:
Monthly - Long, consolidation, Support at 6118.
Weekly - Short, Impulse, Support at 6190 and 6162 and 6100
Daily - Short, Impulse, Support at 6147 and 6098.
No timeframes are oversold so there could be more downside subject as always to the US markets.
James
 
No rally from London this morning so long from last night stopped out for small loss. Little prospect of a Dow-led rally this afternoon either. Looking forward to the weekend so I can't be stopped out again.
 
No rally from London this morning so long from last night stopped out for small loss. Little prospect of a Dow-led rally this afternoon either. Looking forward to the weekend so I can't be stopped out again.


tom

are you following a swing method of some sort or relying on your reading of market conditions (as your entry for this particular trade seemed to suggest)?

good trading

jon
 
I do follow swing trading method but not religiously. I am eager to squeeze additional side-bets on the index which have not (yet) been triggered by Rivalland rules. I try to anticipate swing signals but these moves would be very limited depth and timeframe with absolutely fixed stops: they often don't come off but I'd have to be get literally dozens of these wrong consecutively before it really hurt. Eventually I get one in the right direction way, way before the trigger. The 'true' swing trade positions are always going to be deeper with a longer horizon.
 
If support [at 6275]is breached, a second consecutive double bottom sell signal will be generated. If this happens, the current column of red 'O's would still only be 10 strong, leaving plenty of scope for further falls within the existing column.
Status: BEARISH
Support: 6050-6075 (horizontal red line at 6050)
Resistance 1: 6500
Resistance 2: 6600

Support at 6275 was breached, but not within the existing column of red 'O's (see last week's chart). I've included a daily bar chart as well this week, so that it's easy to cross reference how the action on the P&F chart printed on the daily bar chart. Monday's down bar looked as if it may have found support at the 6300 zone and, additionally, bulls may have been buoyed by the close in the top half of the daily H/L range. Cue a reversal on Tuesday. Tuesday's bar is indeed a blue up bar, but the close is beneath the open near the low of the day. (Yellow ellipse on the bar chart.) On the P&F chart, this prints with the minimum necessary number of just 3 bloo 'X's to register a reversal. Anyone watching the market open on Wednesday at 6299 would know there and then that it would have to rise all the way back up to 6400 for the chart to add just one more bloo 'X' to Wednesday's column of 3 'X's. Failure to do this would result in a new down column of red 'O's. The probability of the latter scenario occurring is well in excess of 90%. One could not wish for a more emphatic sell signal to short or to close any long position. Of course, the same conclusions can be drawn from the bar chart, but it screams out at you on the P&F chart! The subsequent downward pressure on support at 6275 then becomes immense and price collapses. The week ends as it opened, with a bar on Friday that is very similar to last Monday's. If the index opens strongly on Monday 14th, it will only have to rise another 23 points to print another 3 box reversal of bloo 'X's. If it fails to achieve this and drops below last Friday's low at 6150, then it's highly likely that it will fall further to put pressure on the new support areas at 6050-6075. On the other hand, if it does manage to rise those extra few points (without falling to 6125 or lower on the day), bulls will be looking to build a much longer column of bloo 'X's - and quickly too. If they fail and price reverses back down after a short column of only 3-4 bloo 'X's, P&F traders will add to existing shorts or open new short positions. Whichever way you cut it, the odds are stacked heavily against the bulls and in favour of the bears. Apologies for such a long post!
Tim.
 

Attachments

  • 02_FTSE_Bar.jpg
    02_FTSE_Bar.jpg
    121.1 KB · Views: 279
  • 02_FTSE_P&F.jpg
    02_FTSE_P&F.jpg
    243.7 KB · Views: 273
Last edited:
Similar picture on the swing chart, Tim.

The down change to the swing trend has had two confirmations now and no swinger is looking for longs. Those not already short await the first 3 bar reaction.

The 6000 level (give or take) still looks crucial.

good trading

jon
 

Attachments

  • ftseswing.JPG
    ftseswing.JPG
    66.6 KB · Views: 303
Something I came across on another thread here encouraged me to spend a bit of time this weekend looking for a way to replicate swing trading the FTSE using the 14MA. A simple system (hardly deserves the name) using 14MA crossing price generates a signal about every 7 sessions, exiting at the close of the 3rd subsequent session. Stop is the opposite extreme of the entry day's bar, as usual.

Not surprisingly for something so rudimentary, backtesting is not encouraging, giving only a tiny preponderance of winning trades and total points won : points lost only 1.3 : 1. results on the Dow and S&P are slightly worse. But a surpise is that this sytem works so much better on the DAX. Winners to losers 2.5 : 1, points won : points lost 4.8 : 1, av win : av loss 2 : 1, easily outperformed buy-and-holding the index, signals generated only appr. every 12 sessions.

I don't immediately see a reason for the DAX being so much better suited to this approach over the same backtest period but results good enough to encourage me to put some limited money in and try to refine entry and exits.

There are so many ways to make money in this game, I cannot figure out why I am not filthy rich yet. ;-)
 
For what its worth my FTSE charts (from Sharescope data) give:
Monthly - Long, consolidation, Support at 6118.
Weekly - Short, Impulse, Support at 6190 and 6162 and 6100
Monthly and weekly unchanged but daily now showing consolidation and now very oversold. Support at 6188, 6183 and 6178 and 6150 (All CMC prices). Resistance 6250 6289 and many more above. I have a long limit order at 6184 with a tight stop.
All very much 'for what its worth' :)
James
 
FTSE Week 3

Status: BEARISH
Support: 5825 (horizontal red line)
Resistance 1: 6050 (horizontal dotted bloo line)
Resistance 2: 6225 (solid horizontal bloo line)
Solid Pink Line: 20% drawdown from 6750 October highs to 5400 - the point at which the market is 'officially' bearish

Anyone who read my take on the P&F chart last week will have had to pinch themselves for a reality check this week. Call it deja vue, groundhog day or simply history repeating itself, the story this week is a virtual carbon copy of the story from week 2. A one day retracement on Monday resulting in the minimum possible column of just 3 bloo 'X's, followed by a collapse in price on Tuesday and another blinding double bottom P&F sell signal at 6125. If anyone reading this is in any doubt whatsoever regarding the efficacy of these charts, then the evidence from the last two weeks must, surely, be more than enough to convince you of the power and simplicity of P&F analysis. Let's go for the hatrick. There's just enough momentum left in the current column of 14 red 'O's to extend down another 2 boxes to test support at 5825. Again, if like Monday 14th of this week and Tuesday 8th of last week, there is the minimum 3 box reversal of bloo 'X's, look very carefully at what happens next. Will the bulls capitalize on it and mount a rally, or will the retracement only last a day before reversing back down again? If the latter occurs, and the index breaches support and generates another double bottom sell signal, well - you'll know what to do!
Similar story on the Dow: http://www.trade2win.com/boards/us-indices/27979-dow-2008-a-22.html
Tim.
 

Attachments

  • 03_FTSE_P&F.jpg
    03_FTSE_P&F.jpg
    245.2 KB · Views: 315
Last edited:
Interesting read, many thanks.

Hope you don't mind me adding a chart to the thread.
 

Attachments

  • ftse hinge.GIF
    ftse hinge.GIF
    9.7 KB · Views: 264
mmm, three goes at bobbing back above 6000 now and kicked back every time. will post update tomorrow.

good trading

jon
 
Hope you don't mind me adding a chart to the thread.
Of course not tune - more the merrier. It's good to see a line chart too - quite rare these days and most refreshing. And James (jhj), welcome to you too!
Tim.
 
I thought I had better explain my chart. The two lines are there to note the swings. Higher lows with lower highs. The swings are coming in. This pattern is not my invention, it is as old as the hills. Plenty of ancient examples in Schabacker.

Harriman House : Technical Analysis and Stock Market Profits - by Richard Schabacker

As penciled in at the beginning of this thread, volume was gradually dropping away during this period.
 
Last edited:
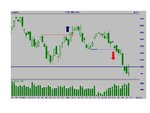
With three days' worth of closes below 6000 with three abortive attempts to climb back above that level, daily and weekly swing trends are now down and the monthly will follow unless there is a pretty startling recovery to above 6300 by the end of January. I suppose that some will point out that the August low of 5822 hasn't gone yet, but I would think that represents very much last gasp support.

For the swingers, the bold have been short since the break of the last swing low from around 6250. Many will have gone around 6000 in anticipation of support coming in at this level. For the more cautious who sit awaiting the first correction it's a frustrating time. The three goes back above 6000 all topped out around the same level as well as being accompanied by lower lows, so no inkling of a tradeable correction yet.

good trading

jon
 

Attachments

  • ftseswing.JPG
    ftseswing.JPG
    66.8 KB · Views: 295
Hi all

Not posted over here for a bit

Not calling anything just an observation

WOW!

rsi week @ 2.96 set on rivailand 5

months finding support at the golden ratio, but I am not going to risk it :)

Q are we parabolic = I have no experience = to young :)
 
Hi all

Not posted over here for a bit

Not calling anything just an observation

WOW!

rsi week @ 2.96 set on rivailand 5

months finding support at the golden ratio, but I am not going to risk it :)

Q are we parabolic = I have no experience = to young :)

Ha cant resist, sorry Barjon

posty over me


and the ftse is ripping through the fib levels stopping at all stops and collecting passengers (not me thank .......)

Have Fun:eek:

5773 fut the Goldon one

UK banks to follow US :eek::eek: 0% interest rates

Stock markets crash, everyone pulled out to buy more houses :cheesy:
 
hiya pinky - knew you couldn't resist for long :LOL:

fun innit :devilish:

good trading

jon
 
Top