timsk said:
db,
Sorry, you've lost me completely. 😕 I don't wish to take the thread off topic but, nonetheless, an explanation would be much appreciated!
Cheers,
Tim.
Tim,
The thing is, is that I created a problem from the getgo.
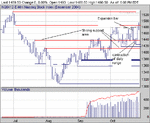
The "prophet.net" charts I posted in the beginning, do not show the whole picture.
They stop showing price action at 4:15pm, and start showing price again at 7:00 am the next day.
The action between 4:15pm and 7:00am is called "overnight action".
The "overnight" action did in fact pass through the trend line I put on the first chart.
Thats why db "cautioned" me about using trend lines, in this study, with his first post to the thread.
And sure enough, it created unintentional confusion.
When I'm doing my analysts, to prepare for the day of trading, first I go to
prophet.net and look at their charts to refresh my memory of what has been happening the last few days. and then I go to
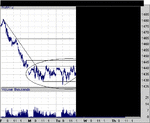
Futuresource .com, and look at what took place over night.
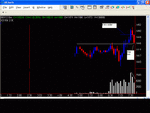
The chart I use for "real time" is
IBcharts.
So thats 3 different charts I look at, to give me as full of picture as I can get.
My mistake was, being too lazy / not prepared, to do the work necessary to attach enough charts to give a complete picture to all, for meaningful dialog,
All is not lost, The important thing to remember, is that the "horizontal lines" (S/R)are more important to focus on than, diagonal lines
We'll see in the future, if I've learned my lesson.
🙂


