Spreadbetting Journal – Trend Strategy

Hecla Mining Exit

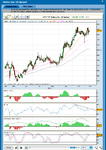
I’ve gone long Hecla Mining using the Dec 10 spread at the US open today, as I was annoyed at being whipsawed out of my Randgold Resources position yesterday, which is now up considerably higher again today. Randgold was far too big for my account size, so I searched for gold miners that track the gold price closely and that were manageable in my account. Hecla seems to fit the bill and was on my watch list, so I decided to get in.

Entry Price: 724.2
Qty: 0.32
Spread: 6

Stop: 662.8
Limit: 900

Account Risk: 0.48%
Potential Account Profit: 1.38%
Risk Ratio: 2.86


Hecla Mining has surged higher for 3 days now and has gained an A+ grade. So although my target was 900, I’m happy to take profits here, as a 13.67% percent move in 3 days has the chance of reversing just as quickly if gold stalls at it’s long term resistance line.

Closing trade
Entry Price: 724.2
Exit Price: 823.2
Qty: 0.32 per point
Points: 99
P/L: £31.69
Trade Percentage: 13.67%

Daily Channel Captured: 66%
Trade Grade: A+

Account P/L: 0.78%
 

Attachments

  • Hecla-Mining_entry_4-11-10.png
    Hecla-Mining_entry_4-11-10.png
    29.5 KB · Views: 162
  • Hecla_Mining_exit_8-11-10.png
    Hecla_Mining_exit_8-11-10.png
    29.3 KB · Views: 157
S&P 500 Long Exit

Think I bought this one too high away from the 100 bar EMA, so am exiting at breakeven and going to wait for the next decent pullback to get back in.

Closing trade
Entry Price: 1220.3
Exit Price: 1220.3
Qty: 0.5 per point
Points: 0
P/L: £0

Daily Channel Captured: 0%
Trade Grade: C-
 

Attachments

  • SP500_exit_8-11-10.png
    SP500_exit_8-11-10.png
    29.9 KB · Views: 214
EUR/USD Stopped Out

EUR/USD has got into my value zone. So as it’s too much risk for my account I’m going to paper trade it.

Trade
Entry Price: 1.394
Stop: 1.3879
Limit: 1.4199

EUR/USD has broken lower in the last hour or so, so my stop would have been hit at 1.3879. So closing paper trade is -61 pips. I’m glad I’m so strict with my risk management for my account and couldn’t trade it for real.
 
Currencies update

USD looks to be picking up strength. EUR/USD signal got within 1 pip of the chandelier stop a little while ago. So looks like the buy signal is going off tonight for EUR/USD. GBP/USD is in the value zone and AUD/USD is moving down towards it. Those two might not turn off as are further from their stops and the negative news is focused on the euro zone again, probably as it’s a quiet news week and traders like to make up a reason to move the markets when there’s no real data to focus on.
 

Attachments

  • AUDUSD_signal_9-11-10.png
    AUDUSD_signal_9-11-10.png
    62 KB · Views: 226
  • EURUSD_signal_9-11-10.png
    EURUSD_signal_9-11-10.png
    65 KB · Views: 162
  • GBPUSD_signal_9-11-10.png
    GBPUSD_signal_9-11-10.png
    63.9 KB · Views: 211
Halma Entry

I’ve gone long in Halma Dec 10 Spread. It was on my watchlist from the weekend scans and it had an inside day yesterday, so I’m looking for the up move to reassert itself.

Trade
Entry Price: 338.60
Qty: 0.7
Spread: 2.42

Stop: 331.49
Limit: 354.14

Account Risk: 0.12%
Potential Account Profit: 0.28%
Risk Ratio: 2.32

Small risk on this one as it’s a different strategy than I usually use.
 

Attachments

  • Halma_Entry_10-11-10.png
    Halma_Entry_10-11-10.png
    28.8 KB · Views: 176
Last edited:
Halma Exit – Stopped out

Closing trade
Entry Price: 338.60
Exit Price: 331.49
Qty: 0.7 per point
Points: -7.11
P/L: -£4.98
Percentage P/L: -2.10%

Daily Channel Captured: -15%
Trade Grade: E

My Halma trade was stopped out a little while after the US opened, but has recovered and closed slightly higher on the day. I made a few mistakes on this one which I hope I will learn from.

1. I used the 4 hour lows to calculate the stoploss position instead of the daily lows.

2. I rushed my entry because I was working and didn’t have the chance to day trade into the position. I imagine this would be ok when using a wide stoploss, but I can’t do it when using such a tight stop. I either shouldn’t have traded or waited till near the close.

3. Finally, I have a negative view on the market currently and think it’s going to pullback a little further. So I’m going to make a new rule for myself that I can only go long stocks when I’m willing to be long the S&P 500.
 

Attachments

  • Halma_Exit_10-11-10.png
    Halma_Exit_10-11-10.png
    27.5 KB · Views: 156
Risk – Stop loss on my account?

I’m back to thinking about risk again as I really think getting it right is the key to me being successful in my spreadbetting account. I’m currently limiting myself to a maximum risk of 1.5% drawdown a month, with a maximum position size of 0.5% per trade. I’m attempting to trade even smaller position sizes than that where possible as 0.5% per trade would mean that I’d be stopped from trading if I had 3 losers in a row for the rest of the month. So position sizes of 0.15% is my target size now.

The question I’ve been pondering today is whether I should attach a trailing stop loss to my profits. i.e. as my max drawdown is 1.5% per month, should I be protecting my profits from eroding and turning into a loss once I reach 1.5% profit in a month? I’m currently 2.54% up in November. So what I’m considering is whether I should now have a trailing stoploss on my account 1.5% below the daily or weekly high for my account at which point I would stop trading for the rest of the month?

I’d be interested to know anyone's thoughts on this who reads this post? PM me or reply in my journal thread if it’s sensible.
 
S&p 500

I’m currently waiting for the pullback on the S&P 500 to reach the 100 Bar EMA on the 4hr chart, which I like to use for as an entry point. My target entry price on the SP 500 Dec Spread is around the 1198 price level, which is the previous high before the breakout and should be supported by the 100 Bar EMA which is moving closer to that level. But if it stabilizes and moves higher from here instead, then I will use a breakout of the trend line on the 4hr RSI instead.

I will aim to keep my position size small in case it’s a reversal of the recent bull trend and add to it if it continues higher.
 

Attachments

  • SP500_4hr_11-11-10.png
    SP500_4hr_11-11-10.png
    30.7 KB · Views: 191
Re: SP 500

I’m currently waiting for the pullback on the S&P 500 to reach the 100 Bar EMA on the 4hr chart, which I like to use for as an entry point. My target entry price on the SP 500 Dec Spread is around the 1198 price level, which is the previous high before the breakout and should be supported by the 100 Bar EMA which is moving closer to that level. But if it stabilizes and moves higher from here instead, then I will use a breakout of the trend line on the 4hr RSI instead.

I will aim to keep my position size small in case it’s a reversal of the recent bull trend and add to it if it continues higher.

SP 500 is breaking out of the RSI downtrend line, so I am going to watch for a retest on the lower time frames and get in if it looks like it will hold.
 

Attachments

  • SP500_4hr_11-11-10_2.png
    SP500_4hr_11-11-10_2.png
    30.3 KB · Views: 198
  • SP500_2hr_11-11-10_2.png
    SP500_2hr_11-11-10_2.png
    29.2 KB · Views: 197
  • SP500_1hr_11-11-10_2.png
    SP500_1hr_11-11-10_2.png
    28.9 KB · Views: 198
SP 500 Entry

Trade
Entry Price: 1210.4
Qty: 0.5
Spread: 0.6

Stop: 1197.4
Limit: 1238.8

Account Risk: 0.15%
Potential Account Profit: 0.35%
Risk Ratio: 2.27

The retest to the trend line came quicker than I thought it might. The indicators on the 2 hour chart were lining up nicely. MACD histogram went positive again and the RSI was well away from the down trend line. So I went to the 2 min chart to watch the price action and bought once the price went above the RSI down trend line on that.

Risk level is my target 0.15%, so hopefully it can’t negatively affect this months gains too much if I’m wrong and the market sells off.
 

Attachments

  • SP500_entry_2min_11-11-10.png
    SP500_entry_2min_11-11-10.png
    28.8 KB · Views: 195
  • SP500_entry_2hr_11-11-10.png
    SP500_entry_2hr_11-11-10.png
    29.3 KB · Views: 194
  • SP500_entry_4hr_11-11-10.png
    SP500_entry_4hr_11-11-10.png
    30 KB · Views: 201
SP 500 Exit

I was stopped out of my long position from last night in the overnight session. I moved too soon and should have waited longer for the pullback after the breakout above the trend line. So am now back to my original target which was the 100 Bar EMA around the 1198 level. However, this was breached much further than the previous 5 or 6 times, so am not willing to get back in yet as it could be breaking down. I think today could be a key day, so will be watching the US session closely to see if I want to get in again before the weekend.

Closing trade
Entry Price: 1210.4
Exit Price: 1197.4
Qty: 0.5 per point
Points: -13
P/L: -£6.50
Trade Percentage: -1.07%

Daily Channel Captured: -18%
Trade Grade: E

Account P/L: -0.16%
 

Attachments

  • SP500_2hr_12-11-10_1240.png
    SP500_2hr_12-11-10_1240.png
    30 KB · Views: 206
  • SP500_4hr_12-11-10_1240.png
    SP500_4hr_12-11-10_1240.png
    29.2 KB · Views: 187
  • SP500_Daily_12-11-10_1240.png
    SP500_Daily_12-11-10_1240.png
    24.9 KB · Views: 216
Sp 500

I’ve been watching this with interest today. It’s currently trying to form a second bottom on the rising trend line. There is a slight indication that it might hold on the 30 min chart with the divergence in the RSI to the price. But the 4 hour is still stuck in it’s down trend.

Overall, the price trend lines are converging and cross on the 16th on the 4hr chart. So I’m watching for a break still, hopefully to the upside on Monday, but if it breaks down I’ve got my hedge in the VIX which would hopefully spike on such a move.
 

Attachments

  • SP500_4hr_12-11-10_1930.png
    SP500_4hr_12-11-10_1930.png
    30.6 KB · Views: 200
  • SP500_30min_12-11-10_1927.png
    SP500_30min_12-11-10_1927.png
    28.3 KB · Views: 187
Weekend Update

Below is my updated trades spreadsheet and account spreadsheet.

I had a fairly quiet week and only placed two new trades, as I was a bit more unsure about market direction this week. I kept the position sizes small, only risking 0.12% and 0.16% on the trades. Both were stopped out fairly quickly, one the same day and one in the overnight trading session.

So two losers this week and zero winners, yet I managed to make a small profit as my long term position in the VIX did it’s hedging job and recovered a bit, which covered the loses and made a bit extra.

So the week ahead is looking more uncertain to me. Attached below is my weekly and daily chart of the S&P 500. The weekly chart is interesting I think, as the price action has bounced off of the long term 61.8% Fibonacci line for the second time this year. But the pullback was only roughly just over half of last weeks weekly bar length. Some of the weekly indicators are in a good buy position now, whereas others are mixed. Personally I’m bullish still, but the recent breakout above the 2 year downtrend line hasn’t been retested yet, so I think there’s a good chance it might after this weeks price moves. Daily indicators are looking more negative, but price is still above the 22 day EMA, so I’m still bullish for now. One warning sign though is that Elder Impulse went red for the first time since mid August. This is just a warning signal, which could go off on Monday, but I think it signals the end of the easy melt up we’ve had and a more volatile period starting.
So short term I think we’ll have volatility and medium term I think the uptrend will continue higher. But, what do I know. This could just as easily be a double top and the market could sell off. Either way I’ll be looking for trades and more importantly to learn to be a better trader.

Have a good week
 

Attachments

  • Trades_spreadsheet_12-11-10.png
    Trades_spreadsheet_12-11-10.png
    13.4 KB · Views: 538
  • Account_spreadsheet_12-11-10.png
    Account_spreadsheet_12-11-10.png
    4.9 KB · Views: 182
  • SP500_weekly_12-11-10.png
    SP500_weekly_12-11-10.png
    148.7 KB · Views: 1,008
S&p 500

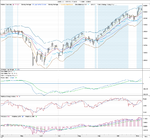
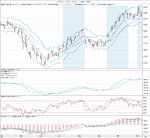
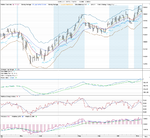
The downtrend line on the 4hr chart RSI that was in place all last week has been broken out from, but price hasn’t broken out above its trend line yet. There’s been a moving average cross to the downside, so I’d expect the price to get up to the value zone and then pullback into the range again. Unless there’s strong good news. I do think the market is going higher in the next few days to retest last weeks high, but I think it’s an ABC move. Last week being the A part. So I’m looking for an entry point on the rising trend line still.
 

Attachments

  • SP500_4hr_15-11-10_1325.png
    SP500_4hr_15-11-10_1325.png
    28 KB · Views: 188
S&P 500 Short Entry

Price was at the top of the range, so thought I’d do a quick short on the SP 500 Dec Spread

Trade
Entry Price: 1200.1
Qty: 0.5
Spread: 0.6

Stop: 1211.7
Limit: 1155

Account Risk: 0.14%
Potential Account Profit: 0.55%
Risk Ratio: 3.89
 

Attachments

  • SP500_10min_15-11-10_1557.png
    SP500_10min_15-11-10_1557.png
    28.1 KB · Views: 231
  • SP500_4hr_15-11-10_1558.png
    SP500_4hr_15-11-10_1558.png
    27.9 KB · Views: 217
Re: S&P 500 Short Entry

Price was at the top of the range, so thought I’d do a quick short on the SP 500 Dec Spread

Trade
Entry Price: 1200.1
Qty: 0.5
Spread: 0.6

Stop: 1211.7
Limit: 1155

Account Risk: 0.14%
Potential Account Profit: 0.55%
Risk Ratio: 3.89

Price dropped down to near the rising 4 hour trend line at the close, so I decided to close the short position for a very small gain as there’s risk it will bounce overnight.

Closing trade
Entry Price: 1200.1
Exit Price: 1196.7
Qty: 0.5 per point
Points: 3.4
P/L: £1.70
Trade Percentage: 0.28%

Daily Channel Captured: 5%
Trade Grade: C-

Account P/L: 0.04%

It was a good intraday trade, but I want put on longer trades as I don’t have time to watch them during the day normally. Charts are below.
 

Attachments

  • SP500_30min_15-11-10_2114.png
    SP500_30min_15-11-10_2114.png
    30 KB · Views: 224
  • SP500_4hr_15-11-10_2114.png
    SP500_4hr_15-11-10_2114.png
    29.4 KB · Views: 211
S&P 500 Long Entry

S&P 500 has broken below the 4 hour up trend line. However, I’ve decided to place a long position as I can see a MACD divergence on the 2 hour chart and RSI has broken above the trend line and is retesting support. Finally price has dipped just below support and rebounded on the 30 min chart, so a possible double bottom here maybe. My risk is tiny on this as so close to the low, so if it breaks down I will only lose what I made today on my intraday trade, but lets see what I get.

Trade
Entry Price: 1192.5
Qty: 0.5
Spread: 0.6

Stop: 1189.4
Limit: 1220.9

Account Risk: 0.04%
Potential Account Profit: 0.35%
Risk Ratio: 9.16
 

Attachments

  • SP500_30min_16-11-10_0130.png
    SP500_30min_16-11-10_0130.png
    30.4 KB · Views: 161
  • SP500_2hr_16-11-10_0130.png
    SP500_2hr_16-11-10_0130.png
    31.6 KB · Views: 169
  • SP500_4hr_16-11-10_0130.png
    SP500_4hr_16-11-10_0130.png
    29.8 KB · Views: 149
S&P 500 Long Exit

The support level didn’t hold and I have been stopped out. Was worth a go though as it was either a swing bottom or it was going to breakdown.

Closing trade
Entry Price: 1192.5
Exit Price: 1189.1
Qty: 0.5 per point
Points: -3.4
P/L: -£1.70
Trade Percentage: -0.29%

Daily Channel Captured: -5%
Trade Grade: D

Account P/L: -0.04%
 

Attachments

  • SP500_5min_16-11-10_0225.png
    SP500_5min_16-11-10_0225.png
    28.8 KB · Views: 181
  • SP500_30min_16-11-10_0225.png
    SP500_30min_16-11-10_0225.png
    30.3 KB · Views: 185
VIX Contract Rollover

My position in the Volatility Index Nov 10 Spread has rolled over into to the Dec 10 Spread contract.

Nov 10 Spread Closing trade
Entry Price: 21.1
Exit Price: 22.45
Qty: 10 per point
Points: 1.35
P/L: £13.50
Trade Percentage: 6.40%

Daily Channel Captured: 17%
Trade Grade: C

Account P/L: 0.34%

Dec 10 Spread Entry trade
Entry Price: 23.6
Qty: 10 per point
Spread: 0.45

Stop: No stop – Long term hedge – max risk £236
Limit: 45

Account Risk: 5.80%
Potential Account Profit: 5.26%
Risk Ratio: 0.91
 
S&P 500 Long Entry

The selling in the S&P 500 looks to have stalled to me, so I’m trying for a swing trade here. I may possibly sell at the downtrend line if it gets there and looks weak. Have a big stop on this one at 0.5%, as I’m willing to let it swing down as far as the 100 Day EMA, as I still think this is corrective period and am hedged with the VIX so should make out about even if it does.

Trade
SP 500 Dec 10 Spread
Entry Price: 1177.7
Qty: 0.5
Spread: 0.6

Stop: 1137.4
Limit: 1223.6

Account Risk: 0.5%
Potential Account Profit: 0.56%
Risk Ratio: 1.14
 

Attachments

  • SP500_30min_17-11-10_entry.png
    SP500_30min_17-11-10_entry.png
    28.2 KB · Views: 175
  • SP500_4hr_17-11-10_entry.png
    SP500_4hr_17-11-10_entry.png
    30.8 KB · Views: 173
Top