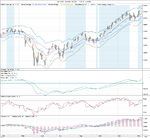
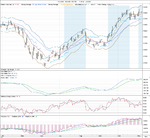
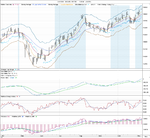
Spreadbetting Journal – Trend Strategy

Re: AUD/USD Signal On

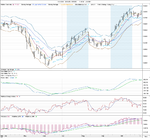
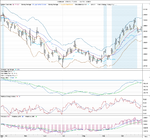
I have another signal on now to watch for an entry point, as the AUD/USD came on tonight. It’s very close to the value zone but one of the indicator criteria isn’t there yet as the Force Index 10 day summation line is still below the 22 day moving average. My discretionary rules to help validate the signal are that I don’t go long until there’s a positive volume crossover on force index, so this is one to watch at the moment – even though it’s tempting. But I think that parity with the dollar is a big headwind still and I’d want to see a close above that before considering going long as well as my signal confirmation.

I got the signal confirmation from the force index volume crossover today as the AUD/USD moved up strongly to parity, but it has lingered there all day. So I’m still not willing to go long yet, as I want a decent close above parity and then a retest back to value for confirmation of the move.
 

Attachments

  • AUDUSD_signal_2-11-10.png
    AUDUSD_signal_2-11-10.png
    62.4 KB · Views: 186
EUR/USD Signal On

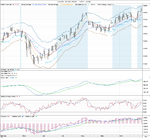
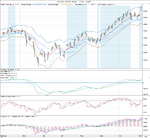
EUR/USD signal also is on now from today’s close. My discretionary indicators confirm it for me. However, it still has an important resistance to overcome before I will look to buy it. For me to go long I need it to make and new high and manage to close above the previous closing high of 1.4079 to show that the bull run is continuing.

This means that I have 3 possible forex trades now in GBP/USD, EUR/USD and AUD/USD; although the GBP/USD is looking most likely to get an entry point this week. I would like to trade all three if they position right, but I think I need to limit myself to a max of 2 currency trades at a time while my account is still so small, especially ones that are all long against the same currency. As I think it would add too much risk as any positive move in dollar would affect them all. Also, another good reason would be that I’m new to forex trading. I’ve always traded stocks and equity markets, so I want to take small steps and keep my exposure small for the time being.

Below is the EUR/USD chart
 

Attachments

  • EURUSD_signal_2-11-10.png
    EURUSD_signal_2-11-10.png
    64.5 KB · Views: 206
Randgold Resources Stopped Out

The gold price seemed to be moving a bit fast to the downside this afternoon so I moved my limit order down a few times, especially after the crude inventories data hit as the gold price took a big down leg at that point. I decided to manage my entry manually using the 2 min and 30 min chart for my entry point.

Trade Details
Randgold Resources Dec 10 Spread
Entry Price: 5779.11
Qty: 0.5
Spread: 24pts

Stop: 5618
Limit: 6500

Account Risk: 2%
Potential Profit: 8.96%
Risk Ratio: 4.47

Entry Grade: 90%

Below is the end of day chart for RRS.

I have been stopped out of my trade in Randgold Resources, after a big sudden fall in the price of Gold this afternoon. Looks like the dollar was the culprit as the currencies look like they are falling as well against the dollar. Am a little bit annoyed I didn’t take profits this morning, as I was around 200 points up, but fortunately I moved my stoploss to breakeven a few days ago, so it closed out at breakeven.

Closing trade
Entry Price: 5779.11
Exit Price: 5779.11
Qty: 0.5 per point
Points: 0
P/L: £0

Trade Grade: C-

Below are the charts
 

Attachments

  • RRS_exit_4hr_3-11-10.png
    RRS_exit_4hr_3-11-10.png
    28.9 KB · Views: 189
  • RRS_exit_30min_3-11-10.png
    RRS_exit_30min_3-11-10.png
    27.8 KB · Views: 183
Risk

I’ve been thinking a bit more about risk today and am questioning whether my current risk strategy isn’t good enough. I currently use Elder’s money management techniques of a maximum risk of 2% per trade and a maximum loss of 6% in a month. If I reach that level then I have to stop trading for the rest of the month or if my open trades add up to that level, then I’m not allowed to put anymore trades on until I move the stop loss up and the risk is reduced below the 6% total level again.

The problem I’m having with this is that if I apply a low risk reward ratio to this of 2 to 1, then I should be making 12% a month to justify this 6% a month risk. Now I’m sure day traders achieve this each month. But I’m a position trader with a full time design job, so I’d be happy with 12% a year in all honesty. So I think I need to rethink my maximum loss per month and my max trade size to be a more realistic risk reward rate overall.

Not sure what it should be yet, but that it needs to be much more conservative than it currently is.

Profit target per month: 3%
Annual profit target: 36%
Risk Reward: 2:1
=> Max risk per month: 1.5%
=> Max risk per trade: 0.5%

This seems possible and would mean a gain on the account of 36% over a year, which I’d be very happy with. Although, I think this is very ambitious still for a part timer like me.

Profit target per month: 2%
Annual profit target: 24%
Risk Reward: 2:1
=> Max risk per month: 1%
=> Max risk per trade: 0.33%

2% a month looks more realistic, but I think with my account size that I will be seriously limited in what I can trade. For example, it would only give me a 34 point stop loss on the GBP/USD at £0.40 per point (the min amount with my broker), which has a 200 day ATR of 124 points at the moment. So 4 times the size of my potential max stop loss. Which would make it untradable for me without day trading into the position. I could however trade the S&P 500 index and stocks below 1000 points so I might have to make do with those for now while I try and increase my capital.

I think I need to think research it a bit more.
 
S&P 500 Long Entry

Entry Price: 1192.4
Qty: 0.5
Spread: ???

Stop: 1174.2
Limit: 1274

Account Risk: 0.22%
Potential Account Profit: 1.00%
Risk Ratio: 4.48

I made the classic mistake of getting into this trade too close to the news event. I got in about 5 minutes after the Fed decision and made another mistake of watching the spread betting chart instead of the prices in the trade window. The charts are a bit behind and my broker widened the spread so I ended up with a price about 6 points or so above the actual price. Doh!
 
GBP/USD Entry zone update

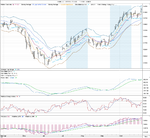
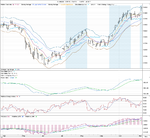
Is very tempting to chase this move. It has moved a good 169 points since the signal came on the 28/10, but the value zone is moving up with it and the initial close from when the signal came on is now in the value range and the GBP/USD made a new high near term high today, so I’m more confident the move will continue now. Below is my new entry range:

Target entry zone – 4/11
11 Day EMA: 1.5995
50 Day EMA: 1.5828
Chandelier Exit: 1.5814
 

Attachments

  • GBPUSD_signal_3-11-10.png
    GBPUSD_signal_3-11-10.png
    65.2 KB · Views: 204
EUR/USD Entry Zone

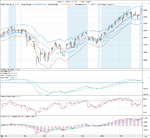
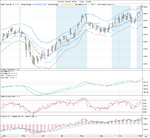
EUR/USD made a new near term high, so has confirmed my discretionary requirements now. So am now looking for an entry point in the value zone below:

Target entry zone – 4/11
11 Day EMA: 1.3997
22 Day EMA: 1.3935
Chandelier Exit: 1.3771
 

Attachments

  • EURUSD_signal_3-11-10.png
    EURUSD_signal_3-11-10.png
    64.4 KB · Views: 176
Re: AUD/USD Signal On

i got the signal confirmation from the force index volume crossover today as the aud/usd moved up strongly to parity, but it has lingered there all day. So i’m still not willing to go long yet, as i want a decent close above parity and then a retest back to value for confirmation of the move.
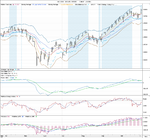
AUD/USD continued up a bit today and managed a close at 1.0058, so I’m looking for a few more days above the parity level and then an entry in the value zone on a pullback.

Current value zone – 4/11
11 Day EMA: 0.9916
50 Day EMA: 0.9716
Chandelier Exit: 0.9706

14 day ATR is currently 0.0107
 

Attachments

  • AUDUSD_signal_3-11-10.png
    AUDUSD_signal_3-11-10.png
    62.3 KB · Views: 155
EUR/GBP Signal On

EUR/GBP is the other currency pair I’m following and it’s signal is now active as well as the other three I follow. I am tentative though, as it’s very close to it’s value zone and the Chandelier Exit stop and has been crossed it on both of the last two days. So I think for confirmation I’d like to see a full day close above the Chandelier Exit stop before looking for a pullback to value for an entry point.

Current value zone – 4/11
11 Day EMA: 0.8745
22 Day EMA: 0.8737
Chandelier Exit: 0.8723

14 day ATR is currently 0.0075
 

Attachments

  • EURGBP_signal_3-11-10.png
    EURGBP_signal_3-11-10.png
    68.4 KB · Views: 170
Hecla Mining Entry

I’ve gone long Hecla Mining using the Dec 10 spread at the US open today, as I was annoyed at being whipsawed out of my Randgold Resources position yesterday, which is now up considerably higher again today. Randgold was far too big for my account size, so I searched for gold miners that track the gold price closely and that were manageable in my account. Hecla seems to fit the bill and was on my watch list, so I decided to get in.

Entry Price: 724.2
Qty: 0.32
Spread: 6

Stop: 662.8
Limit: 900

Account Risk: 0.48%
Potential Account Profit: 1.38%
Risk Ratio: 2.86
 

Attachments

  • Hecla-Mining_entry_4-11-10.png
    Hecla-Mining_entry_4-11-10.png
    29.5 KB · Views: 213
  • Hecla-Mining_4hr_4-11-10.png
    Hecla-Mining_4hr_4-11-10.png
    28.3 KB · Views: 182
Re: EUR/GBP Signal On

EUR/GBP is the other currency pair I’m following and it’s signal is now active as well as the other three I follow. I am tentative though, as it’s very close to it’s value zone and the Chandelier Exit stop and has been crossed it on both of the last two days. So I think for confirmation I’d like to see a full day close above the Chandelier Exit stop before looking for a pullback to value for an entry point.

Current value zone – 4/11
11 Day EMA: 0.8745
22 Day EMA: 0.8737
Chandelier Exit: 0.8723

14 day ATR is currently 0.0075

The EUR/GBP signal wasn’t confirmed today as the low passed through the chandelier stop again. So the signal is still off as it needs the full range to stay above the chandelier stop for it to be a buy.
 
Currencies update

The dollar fell again today, moving the various currencies I’m watching away from my entry targets again. So I’ve readjusted my target entry zones as follows:

AUD/USD
Current value zone – 5/11
11 Day EMA: 0.9971
22 Day EMA: 0.9898
Chandelier Exit: 0.9810

14 day ATR is currently 0.0110

EUR/USD
Current value zone – 5/11
11 Day EMA: 1.4047
22 Day EMA: 1.3968
Chandelier Exit: 1.3866

14 day ATR is currently 0.0122

GBP/USD
Current value zone – 5/11
11 Day EMA: 1.6064
22 Day EMA: 1.5972
Chandelier Exit: 1.5933

14 day ATR is currently 0.0112
 

Attachments

  • AUDUSD_signal_4-11-10.png
    AUDUSD_signal_4-11-10.png
    61.9 KB · Views: 204
  • EURUSD_signal_4-11-10.png
    EURUSD_signal_4-11-10.png
    64 KB · Views: 191
  • GBPUSD_signal_4-11-10.png
    GBPUSD_signal_4-11-10.png
    64.5 KB · Views: 191
Re: Risk

I’ve been thinking a bit more about risk today and am questioning whether my current risk strategy isn’t good enough. I currently use Elder’s money management techniques of a maximum risk of 2% per trade and a maximum loss of 6% in a month. If I reach that level then I have to stop trading for the rest of the month or if my open trades add up to that level, then I’m not allowed to put anymore trades on until I move the stop loss up and the risk is reduced below the 6% total level again.

The problem I’m having with this is that if I apply a low risk reward ratio to this of 2 to 1, then I should be making 12% a month to justify this 6% a month risk. Now I’m sure day traders achieve this each month. But I’m a position trader with a full time design job, so I’d be happy with 12% a year in all honesty. So I think I need to rethink my maximum loss per month and my max trade size to be a more realistic risk reward rate overall.

Not sure what it should be yet, but that it needs to be much more conservative than it currently is.

Profit target per month: 3%
Annual profit target: 36%
Risk Reward: 2:1
=> Max risk per month: 1.5%
=> Max risk per trade: 0.5%

This seems possible and would mean a gain on the account of 36% over a year, which I’d be very happy with. Although, I think this is very ambitious still for a part timer like me.

Profit target per month: 2%
Annual profit target: 24%
Risk Reward: 2:1
=> Max risk per month: 1%
=> Max risk per trade: 0.33%

2% a month looks more realistic, but I think with my account size that I will be seriously limited in what I can trade. For example, it would only give me a 34 point stop loss on the GBP/USD at £0.40 per point (the min amount with my broker), which has a 200 day ATR of 124 points at the moment. So 4 times the size of my potential max stop loss. Which would make it untradable for me without day trading into the position. I could however trade the S&P 500 index and stocks below 1000 points so I might have to make do with those for now while I try and increase my capital.

I think I need to think research it a bit more.

I’ve decided after experimenting with the figures some more that 1.5% maximum risk per month is the level I want to work with for now. As even though I’m an amateur, I want to trade in as professional way as possible. My current target is to make 3% profit per month, so if my risk reward is a minimum of 2:1 then 1.5% risk is my limit.

Profit target per month: 3%
Annual profit target: 36%
Risk Reward: 2:1
=> Max risk per month: 1.5%
=> Max risk per trade: 0.5%

I won’t include my open position in the VIX in the monthly calculation as it is a hedge against volatility in the market, but has a limited downside of 5% of my account. My current open positions add up to 1.12% risk, so that means I can put on another 0.38% risk currently until I move up stop losses or close another position.

Because of my account size, this risk level per trade means that I won’t be able to trade currencies for the time being. As the stops would need to be ultra tight and would lead to too much whipsaw risk. So I am going to paper trade the currency pairs I’m following, but with an account big enough to trade at this risk level at my spreadbetting firms min bet sizes, which I estimate to be around £15,000. Hopefully, if I can trade it successfully, then I’ll be able to put on physical trades in my spreadbetting account once it’s grow sufficiently or I manage to deposit more cash into it – which is more likely to come first.
 
S&P 500 Long Exit & Re-entry

I decided to err on the side of caution before the jobs number, as was a good chance the markets would sell off it had been bad. So I took my profits on the S&P 500 5 mins before the news. However, the news turned out to be strong so I reentered again.

Closing trade
Entry Price: 1192.4
Exit Price: 1214.5
Qty: 0.5 per point
Points: 22.1
P/L: £11.05

Daily Channel Captured: 31%
Trade Grade: A

Reentry trade
Entry Price: 1220.3
Qty: 0.5
Spread: 0.6

Stop: 1177.9
Limit: 1300

Account Risk: 0.52%
Potential Account Profit: 0.98%
Risk Ratio: 1.88

This is slightly over my min trade limit of 0.5% risk, but it has a very wide stop, which I will readjust at the close today once the news has been digested by the market.
 

Attachments

  • SP500_exit_5-11-10.png
    SP500_exit_5-11-10.png
    29.6 KB · Views: 166
  • SP500_re-entry_5-11-10.png
    SP500_re-entry_5-11-10.png
    29.9 KB · Views: 166
Weekend Update

I was nervous coming into this week with all the data, possibility of QE2 and the mid term elections. But this week turned out to be a good one, and I managed to ride the positive sentiment fairly well.

Performance this week was up 2.21% on last weeks close. It could have been much better if I’d taken profits on my Randgold position, but the speculation about QE2 drove gold prices down sharply during Wednesday, only to recover after the news and whipsawed me out of my position as my stop was hit.

I’ve attached my trades spreadsheet below with my closed and open trades to date. I’ve highlighted my current open risk and profit and loss. Trade grades are determined by the amount of the daily Keltner channel captured. 30% and above is an A grade and my target for all trades. Anything below a C- is a loss.

Also attached is the weekly profit and loss sheet which shows my current profit at 3.25%. I will create an equity graph after I have a few months data so I can chart my progress visually as well.
 

Attachments

  • Trades_spreadsheet_5-11-10.png
    Trades_spreadsheet_5-11-10.png
    12.1 KB · Views: 151
  • Account_spreadsheet_5-11-10.png
    Account_spreadsheet_5-11-10.png
    4.4 KB · Views: 165
Open Positions Charts

Attached below is the current daily charts of the open positions I have except the VIX. Vedanta and Hecla Mining would get an A+ grade for the trade if I closed them now, so I will be watching them closely on Monday as I don’t want to see the 2.21% gain from last week evaporate, which could happen easily with Vedanta as it has a big daily ATR. So I may be tempted to take the profits on that one.

The S&P is very small position, so I will be looking to add to that on pullbacks to value if the up move continues. It is going to be a quiet week for data, so am hoping for less volatility and a continuing rally this week.
 

Attachments

  • Hecla_Mining_5-11-10.png
    Hecla_Mining_5-11-10.png
    50.5 KB · Views: 191
  • Vedanta_5-11-10.png
    Vedanta_5-11-10.png
    57.1 KB · Views: 182
  • SP500_5-11-10.png
    SP500_5-11-10.png
    56.5 KB · Views: 179
Stock Watchlist

I’ve been thinking about a new strategy that I’d like to trial. It’s a breakout strategy that looks for stocks that are breaking out above long term resistance of their previous highs. The thinking behind this is that once all previous resistance levels are cleared, then the stock is in a price discovery phase, with only technical resistance at Fibonacci levels and general market down swings to combat. As the majority of people in the stock are making money, so have less reason to sell.

So I’ve used my buy signal indicator and scanned the market to find stocks in a current uptrend and then filtered out the ones that hadn’t cleared their previous highs, and finally I filtered out the ones with bad balance sheets. Below is what I’ve got left.

Amec (AMEC)
Antofagasta (ANTO)
Ashmore (ASHM)
Bhp Billiton (BLT)
Blackrock Wld (BRWM)
Domino's Pizza (DOM)
Fresnillo (FRES)
Hargreaves Lans (HL.)
Halma (HLMA)
Hochschild (HOC)
Petrofac (PFC)
Premier Oil (PMO)
Schroders (SDR)
Spirent (SPT)
Talvivaara (TALV)
Wellstream (WSM)

From looking at their charts, I’m liking Amec (AMEC), Ashmore (ASHM), Premier Oil (PMO) and Halma (HLMA) the most. Oil had a good rebound this week and has lagged the commodities rally so far, so could be a good way to go for me via PMO or AMEC. AMEC looks a bit more overextended, so I’d want a pullback on that one before getting in. Anyway, I’ve created a watchlist portfolio on ADVFN, so I can see how they all perform with live prices in one place, and will maybe trade one or two this week if they set up right.
 
Currencies update

The signals still look valid for AUD/USD, EUR/USD and GBP/USD. But I’ve not managed to find a safe entry point yet. EUR/USD has pulled back very close to it’s value zone, so a possible entry point there. The other two are still moving away from my targets, but the value zones have moved to the previous resistance levels, so am hopeful that they will get a retest.

AUD/USD
Current value zone – 8/11
11 Day EMA: 1.0025
22 Day EMA: 0.9940
Chandelier Exit: 0.9821
14 day ATR: 0.0113

EUR/USD
Current value zone – 8/11
11 Day EMA: 1.4023
22 Day EMA: 1.3966
Chandelier Exit: 1.3865
14 day ATR: 0.0132

GBP/USD
Current value zone – 8/11
11 Day EMA: 1.6092
22 Day EMA: 1.6001
Chandelier Exit: 1.5936
14 day ATR: 0.0117
 

Attachments

  • AUDUSD_signal_8-11-10.png
    AUDUSD_signal_8-11-10.png
    62 KB · Views: 163
  • EURUSD_signal_8-11-10.png
    EURUSD_signal_8-11-10.png
    64.5 KB · Views: 157
  • GBPUSD_signal_8-11-10.png
    GBPUSD_signal_8-11-10.png
    63.9 KB · Views: 173
Re: Vedanta Entry

I’ve opened a position on the Vedanta Dec 10 Spread as it looks to me like a swing bottom is forming.

Entry Price: 2075.98
Qty: 0.5
Spread: 15.4pts

Stop: 2029
Limit: 2600

Account Risk: 0.58%
Potential Account Profit: 6.44%
Risk Ratio: 11.15

I hold this in my ISA portfolio as a medium term holding and has dropped around 10% from a recent high. So I’m hoping it will be a good swing trade. I’ve got a tight stop, so the risk is low. But could get stopped out quickly on this one if it breaks the recent low.

I’ve closed the trade in Vedanta this morning for a good 11.64% move. I will still keep it in my ISA portfolio though as a long term hold. But I wanted to bank the 2.97% profit for my account, as the safezone stop loss was still only at breakeven. So, the risk was too high for me, even though I believe medium term it will go much higher.

Closing trade
Entry Price: 2075.98
Exit Price: 2317.64
Qty: 0.5 per point
Points: 241.66
P/L: £120.83
Trade Percentage: 11.64%

Daily Channel Captured: 59%
Trade Grade: A+

Account P/L: 2.97%
 

Attachments

  • Vedanta_exit_8-11-10.png
    Vedanta_exit_8-11-10.png
    29.3 KB · Views: 168
  • Vedanta_exit_4hr_8-11-10.png
    Vedanta_exit_4hr_8-11-10.png
    30.4 KB · Views: 170
EUR/USD Entry Zone

EUR/USD has got into my value zone. So as it’s too much risk for my account I’m going to paper trade it.

Trade
Entry Price: 1.394
Stop: 1.3879
Limit: 1.4199
 
Top