SH-101
Well-known member
- Messages
- 390
- Likes
- 29
So why did I fancy a cable long?
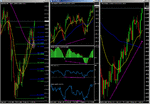
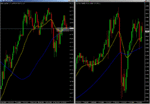
Daily chart was clearly trending up with a pattern of higher highs and higher lows. The 20ema crossing above the 60sma can also be used to indicate potential bullishness.
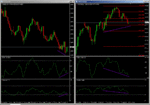
Decent bullish hidden divergence on the 4h chart, shown here in MACD, RSI and momentum oscillators.
A good support cluster - 23.6% retrace of the upswing from 20/05 to 08/07 combined with 61.8/76.4 retraces of the 01/07 to 08/07. Throw in the 100-day SMA (pink) and 20ema (yellow) and there's 4 reasons for support right there.


