You are using an out of date browser. It may not display this or other websites correctly.
You should upgrade or use an alternative browser.
You should upgrade or use an alternative browser.
SH-101
Well-known member
- Messages
- 390
- Likes
- 29
Out of the trade at break-even.
Or to be more precise, a 0.05% loss as a result of one day's rollover.
So that's three trades in the books so far this month, somewhat below average. In truth there have been other opportunities that I've missed due to over-cautiousness and/or laziness, but I have no time for woulda-coulda-shoulda :whistling
Trades so far this month:
AUD/JPY for -0.13%
AUD/USD for +8.24%
GBP/JPY for -0.05%
Total so far is +8.06% for the month. Not quite at my monthly target yet, so back to work... 🙂
SH-101
Well-known member
- Messages
- 390
- Likes
- 29
Some general market observations:
I'd be tempted to get long AUDUSD around current levels, but I don't think there is sufficient support.
EURGBP is sitting in a good cluster of support levels. I'm mulling over the possibility of getting long at the moment.
USDJPY looks bullish to me, but the recent price action is a bit too messy for my tastes.
SH-101
Well-known member
- Messages
- 390
- Likes
- 29
Order placed to buy EUR/GBP at 0.8963 offered. If-done stop 0.8923 bid, if-done limit 0.9023 bid.
Only risking 2.5% on this one. I have a nagging doubt about the strength of the technical setup, but I do like the support area. If the trade turns out to be a winner I hit my target for the month, if it turns out to be a loser I'll still only be one winner away from reaching my monthly target, as I am now.
Only risking 2.5% on this one. I have a nagging doubt about the strength of the technical setup, but I do like the support area. If the trade turns out to be a winner I hit my target for the month, if it turns out to be a loser I'll still only be one winner away from reaching my monthly target, as I am now.
SH-101
Well-known member
- Messages
- 390
- Likes
- 29
AUD/USD order filled.
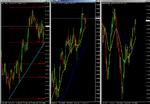
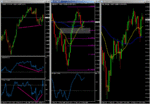
Attached screenshots show an upwardly trending market as per 20ema and 60sma on 4h and daily charts. Also shown is fibonacci and trendline support.
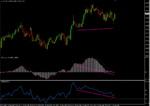
The 1-hour chart shows bullish hidden divergence on MACD(12/26/9) and CCI(50).
Attached screenshots show an upwardly trending market as per 20ema and 60sma on 4h and daily charts. Also shown is fibonacci and trendline support.
The 1-hour chart shows bullish hidden divergence on MACD(12/26/9) and CCI(50).
Attachments
SH-101
Well-known member
- Messages
- 390
- Likes
- 29
Stopped out of AUD/USD for a 5.01% loss.
That knocks me back to a gain of 3.05% for the month. However I have to honestly say I am trading like a bit of a muppet at the moment 🙂lol🙂 so I'm glad to still be just one winner away from reaching my monthly target!
That knocks me back to a gain of 3.05% for the month. However I have to honestly say I am trading like a bit of a muppet at the moment 🙂lol🙂 so I'm glad to still be just one winner away from reaching my monthly target!
SH-101
Well-known member
- Messages
- 390
- Likes
- 29
General lack of clear signals at the moment! I've been looking at a potential AUD/USD long and/or USD/CAD short from near current levels but the setups aren't quite right and I have the feeling that both would constitute "chasing" trades so staying flat for now 😴
SH-101
Well-known member
- Messages
- 390
- Likes
- 29
Order filled on EUR/GBP.
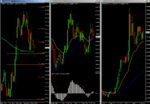
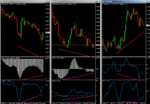
The screenshots below show the usual fayre - 20ema and 60sma crosse3d up and sloping up on the monthly chart. They are crossed up and flat on the weekly but we have the additional confirmation of a rising MACD, crossed above zero, sloping up and above its signal line. We can also see support from a key fib level and the 100-day SMA.
We have bullish hidden divergence on the daily chart, and bullish regular divergence on both 4h and 1h charts.
Attachments
SH-101
Well-known member
- Messages
- 390
- Likes
- 29
Out of bed a little late this morning but just in time to see my limit/target hit on EUR/GBP :cheesy:
From 5% initial risk, this trade produced a final gain of 8.37% after one day's rollover, and takes my total gains for the month to 11.42%, meaning I've now hit my target for the month.
That's not to say I've finished trading - if a good setup comes along I'll trade it - but I am conscious of the fact that I'm lucky to have hit my targets this month because my own personal performance has been poor, so I might be a little extra choosy over any setups that appear between now and the start of next month.
Last edited:
SH-101
Well-known member
- Messages
- 390
- Likes
- 29
I've also put in an order to short cable at 1.5113 bid, if-done stop 1.5194 offered, if-done limit 1.4958 offered.
One potential dollar long and one potential dollar short - I'll either be very right, very wrong, or half right and half wrong. With good r/r that's two possible profitable outcomes and one possible losing outcome, so we shall see... 😱
One potential dollar long and one potential dollar short - I'll either be very right, very wrong, or half right and half wrong. With good r/r that's two possible profitable outcomes and one possible losing outcome, so we shall see... 😱
SH-101
Well-known member
- Messages
- 390
- Likes
- 29
The AUD/USD setup saw the daily 20ema crossed above the 60sma, with both sloping up. They were also crossed up on the 4hr chart, but the 60sma was sloping down. Additional confirmation can be seen in a CCI(50) oscillator, crossed above zero for a number of bars.
We can see bullish hidden divergence in RSI(14) and CCI(14) oscillators on the 1hr chart, which actually also evolved into a small bullish regular divergence as well.
The 4hr chart shows price testing an area of previous resistance to see if it will now hold as potential support - combined with a key fib level, with the 20ema also effectively acting as support.
Attachments
Similar threads
- Replies
- 2
- Views
- 2K
- Replies
- 1
- Views
- 2K
- Replies
- 653
- Views
- 132K

