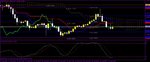
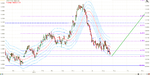
You probably would never guess this, but I was getting ready to psot this chart, as well as make a point of it in my Weekly Report. The yellow lines are my monthlies, which is where price is headed to, and it is 1.0180. I saw the cirvilinear envelope, as my friend, Daniel sent to me, and rock bottom on the CE before it moves UP is 1.0168.
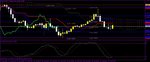
The next position concerning the Swissy I'm looking for is that entry at the MS2. If it makes some obscene retacement beofer it gets there, then I may consider s short, but it would have to be an ideal entry like I was shooting for today that I never got.
That makes for another point. Sometimes in looking ofr an entry, I may not look for the ideal place for it to pull back to, but for an ideal place with respect to an entry for a trade. That is a big difference. When we start getting close like we are now, it is the only way to do it, when you know the reversal is impending.
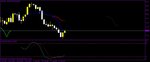
Another thing about reversals is that you don't know (At least I don't know.) The exact personality it will take on. Some of the things at this point I know is that there will be lots of R's it will meet with. 1.0930 is still minimum expectations. It's the pattern of the initial move that is ahrd to tell.
I got to laugh, Dave, that we are that close again.