Some of my trades, forecasts

Status
Not open for further replies.
Re: Eurchf

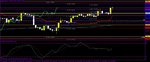
For a new trade, and we know this will blow up, once it gets its long's bearing together, but there is a tenuous feel for opening a position, even now. The CE shows price action at the bottom of the envelope, but it is still showing there is further ground south. Keep watching this pair. Once leveled is when the fun will begin. It is buried unde -2 sigma.
BTW even -2 sigma will keep dropping as the downward momentum continues.


Paul,
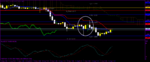
Here are the charts for what it seems to be the big opportunity this week.
This might be a good set up to describe the opportunities of a pair at -2 sigma to other people who never seen the how it works.
I want to think that we will see a momentum crossover on the signal band chart tomorrow, but notice that the decomposition chart shows another leg down. I can post the charts tomorrow to show the development of this potential trade.

Good luck tomorrow everyone!
 
Re: Eurchf

MT, it is going to be about 10-12 hours from this writing that DEC gets back. The 1.08 on the black and red momentum indicators show the difference in the deviation. So, if you subtract .108 from the 1.3099, then you get a -3 sigma at 1.2991.
The red signal line on the chart is also something to look for. It is too far north to worry about right now. The point is if you get a cross in one of the extremities, then that adds to the fun.
Another point about the sigma bands. They adjust daily. With the strong momentum, when the new ones come out today, there should be a further drop. This is how they adjust to price action.


nice charts DEC. Potentially then if eurchf doesnt bounce here it could get down to 3 sigma band level at 1.28 - 1.29 level (approx)
 
Eur/aud

I was too tired to post it in this forum, but I went long this pair during a private conversation with DEC at 1.4275. The struggle it is currently going through it at the WR1 at 1.4380. It has lost its elasticity, so it will get broken and head to theMP at 1.4399. After a struggle there, it will move on to the WR2 1.4444. That will be where I will TP.
That is not ideal, though. If we get a full reversal at that point it is going to be choppy again. We need a move to at least 1.4563, and even 1.4712. The higher the better. Afterwards, the demise will begin. It could head to sub-1.4, but not yet confirmed. This pair cannot gets it grip on the LT UP yet.
Aussie is also in a strong move DOWN, and I suppose it will continue to at least .8682 before the reversal. It's reversal will also be sharp, which will coincide with what is happening to this cross.
 
Re: Eur/aud

I know this is really cheesy, so I already chewed me out. I didn't make the post on the entry, and now I'm posting that I'm out of the trade at 1.4401.
The point behind this post is that we will probably get a return to the UP and 1.4444 will get hit, but it missed it by 5 points, and no need to take chances. The ideal scenario is still 1.4563 or even 1.4712. It still might get hit, but I'm not trading the long from here. I will be looking for a short on it if it gets in the latter mentioned area.


I was too tired to post it in this forum, but I went long this pair during a private conversation with DEC at 1.4275. The struggle it is currently going through it at the WR1 at 1.4380. It has lost its elasticity, so it will get broken and head to theMP at 1.4399. After a struggle there, it will move on to the WR2 1.4444. That will be where I will TP.
That is not ideal, though. If we get a full reversal at that point it is going to be choppy again. We need a move to at least 1.4563, and even 1.4712. The higher the better. Afterwards, the demise will begin. It could head to sub-1.4, but not yet confirmed. This pair cannot gets it grip on the LT UP yet.
Aussie is also in a strong move DOWN, and I suppose it will continue to at least .8682 before the reversal. It's reversal will also be sharp, which will coincide with what is happening to this cross.
 
Nzd/usd

This is the last of the old positions I opened, what now seems eons ago. I closed it at .6951 for +382 pips.
Like the others, it will probably go lower, but 'm just clearing the board, still, and happy with the pips I got.
 
Aud/usd

We are now entering a strong S zone on the weekly chart. Aussie is sitting on top the tenken at .8768, then it has the kijun to deal with at .8727. By the time it gets to .8682, it could be wore out.
There is a point that a strong correction will take place, which is what I will be looking for. .8860 chould be containment, depended on what kind of action we see here and the actual time of reversal.
LT, this pair should now firmly have its oars in the water as it paddles downstream to .8000, and maybe lower.
2 months ago, .7827 was on the radar. The beginning of my thread will confirm that original outlook. The problem was we ran into a snowstorm blew this pair upwards in a strong current. In the interim the bottom of the cloud adjusted (Ichimoku is dynamic. It's my S&R's that are not.). That changes things. A move to .7735 is still not to be ruled out.
 

Attachments

  • audusdweekly.jpg
    audusdweekly.jpg
    102.1 KB · Views: 122
Eur/usd

What we see happening on the daily chart is why we see things going sideways on the 4-hour, hourly, 30-min, 15-min, and 5-min charts. The pair wants to correct, but the top of the cloud and the tenken are in the way at 1.2734-55. It has made a safe return to the YS1 at 1.2640. Therefore, price action has been contained the last 3 days within said parameters.
It looks favorable YS1 gets broken and a move to the bottom of the cloud will now take place, and then a very strong correction will ensue at that point. At present, the bottom of the cloud is 1.2452.
 

Attachments

  • eurusddaily.jpg
    eurusddaily.jpg
    95.9 KB · Views: 144
Gbp/cad

I mentioned in my WR about the potnetial of this pair moving to 1.6602. Look for a reaction at the yellow line on top. The yellow lines are my monthlies, and it is my MR2 at 1.6561. Nothing has changed with regards to the high end of 1.6602, but the MR2 could end up being containment. We will get a bounce, but its the kind of bounce at the MR2 that will decide if we are in the DOWN. 1.5739 is the minimum expectation for the DOWN. I'm tempted to double up at 1.6561.
 

Attachments

  • gbpcad4hr.jpg
    gbpcad4hr.jpg
    89.6 KB · Views: 128
Re: Nzd/usd

This is the last of the old positions I opened, what now seems eons ago. I closed it at .6951 for +382 pips.
Like the others, it will probably go lower, but 'm just clearing the board, still, and happy with the pips I got.

Nice 4x. that one i think is a potential short term buy at .6900. what do you think? maybe a bit premature
 
Hi 4xpipcounter.
I've noticed clouds in your attachments. Are they main part of your decision making?
Regards
 
Re: Nzd/usd

Hi MT! I agree with you. This is a quote from my WR, "In essence, it will make a great short to .6917--.6833."
The low end has been raised a littel to .6850. The pair is now camping around the bottom of the daily cloud, the weekly 200 Ma and kijun. The correction's range is .6984--.7241. At this point, circa .7100 looks practical, but subject to change as the correction progresses. Still, at this point, it is like staring around a corner.


Nice 4x. that one i think is a potential short term buy at .6900. what do you think? maybe a bit premature
 
Bedsit, the ichimoku cloud is the cornerstone of my methodology. It still needs to line up with my S&R's. The nice thing about the setup is that the ichimoku cloud is dynamic, and my S&R's are static, as the are predetermined before the timeframe begins, whether it be daily, weekly, monthly, yearly, or even the decade's.
MY S&R's help me in determining an entry once the candles have risen too far above the cloud or dipped to far under. The velocity or momentum of the impending move helps me to determine what type of a move it is, complete reversal, complete correction, minor correction, headfake, etc.
On the way up or down, if price is having trouble with the tenken or the kijun, then that is either a warning of a reversal back in the original trend, or just a temporary impedence. You can always depend on a reaction of the key levels on the ichimoku, but then to interpret those reactions is what determines current and future direction, and ascertain entries for a position.
Just as an example (and there are many), I've alluded to the loonie. There is, at the very least, a huge correction about to occur, because it is flying too high above the 4-hour could and the daily cloud. It was predetemined that price was going to hit the WR2 at 1.0639, and price has struggled around that point for the last 32 hours. Momentum tells me it is still favorable for a move to my MR3 at 1.0702. It also suggests that would make the ideal short, because it will hit near the top of the range, with all the other obviations involved.
For now what we see is a very strong consolidative process with the WR2 because of the continuation through the WR1, so it is now in doubt what it wants to do. Once the doubt passes, it should be on its way to the MR3, and then be reintroduced at least to the top of the 4-hour cloud, if not the daily.


Hi 4xpipcounter.
I've noticed clouds in your attachments. Are they main part of your decision making?
Regards
 
Another point of note I forgot to make is that during that entire consolidative process, price is being supported by the 4-hour tenken, which also poses the likelihood of said move towards the MR3.
 
Bedsit, the ichimoku cloud is the cornerstone of my methodology. It still needs to line up with my S&R's. The nice thing about the setup is that the ichimoku cloud is dynamic, and my S&R's are static, as the are predetermined before the timeframe begins, whether it be daily, weekly, monthly, yearly, or even the decade's.
MY S&R's help me in determining an entry once the candles have risen too far above the cloud or dipped to far under. The velocity or momentum of the impending move helps me to determine what type of a move it is, complete reversal, complete correction, minor correction, headfake, etc.
On the way up or down, if price is having trouble with the tenken or the kijun, then that is either a warning of a reversal back in the original trend, or just a temporary impedence. You can always depend on a reaction of the key levels on the ichimoku, but then to interpret those reactions is what determines current and future direction, and ascertain entries for a position.
Just as an example (and there are many), I've alluded to the loonie. There is, at the very least, a huge correction about to occur, because it is flying too high above the 4-hour could and the daily cloud. It was predetemined that price was going to hit the WR2 at 1.0639, and price has struggled around that point for the last 32 hours. Momentum tells me it is still favorable for a move to my MR3 at 1.0702. It also suggests that would make the ideal short, because it will hit near the top of the range, with all the other obviations involved.
For now what we see is a very strong consolidative process with the WR2 because of the continuation through the WR1, so it is now in doubt what it wants to do. Once the doubt passes, it should be on its way to the MR3, and then be reintroduced at least to the top of the 4-hour cloud, if not the daily.

Thanks for the explanation 4xpipcounter.
Bit difficult to follow it as I don't know much about the clouds. It seems like a good system (judging by your success) and I'll do some studying if I can find a nice book (or on the internet)
Best wishes
 
I admit to having one of the most peculiar methodologies ever. It was not organized as such just to be different, but to fit my personality. Therefore, the amalgamtion of my S&R's with the IC, and the way I use the stochastics will add up to something that may be complicated for the casual observer to catch all its twists and turns. After all, one time I'm referring to the IC and one of its components, another time my S&R's, and then another time momentum of a move, and then a trend's range. I better be quiet or I'm going to get confused.
I could recommend "Ichimoku Charts" by Nicole Elliot. Also you can refer to my blog at 4xpipcounter.blogspot.com for a complete series on the ichimoku cloud. The 5-part series began in Nov. 2007. That was also followed up by a series on my S&R's.


Thanks for the explanation 4xpipcounter.
Bit difficult to follow it as I don't know much about the clouds. It seems like a good system (judging by your success) and I'll do some studying if I can find a nice book (or on the internet)
Best wishes
 
Quaid, a double thanks. First, it's hard to believe it's been almost 2 weeks aleady that I have been back. It was wonderful! But, then, it is wonderful being back.
When I first got introduced to the ichiimoku cloud in 2007, I found this exact site, and it was really helpful. I hope it might be of benefit to others.


Hi again Paul.

Hope your vacation went well. I had mentioned an oracle once, and you asked who it was. I think you mentioned the oracle. In addition to the book, the following is a great online resource for ichimoku:

http://www.kumotrader.com/ichimoku_wiki/index.php?title=Main_Page

Hope this helps.
 
A common S&R trait

This is a common S&R trait. Attached is a chart of the EUR/CHF. First, notice how price action straddled the WS1, then broke away, and then their was a continuance of closes under the WS1 line. What this means is the next stop is WS2. If this seems like hindsight, don't forget how my personal view changed concerning it after momentum gave out after its rise. Also, hindsight has to be used in order to show examples.
The WS2 at 1.2972 was hit, as the low was actually 1.2971.
Mnay times I aluded to how my S&R's help in determining a trend's range. WP--WS1--WS2 is an equi-88 pips. This means that for this week the EUR/CHF's range is 88 pips. What we saw with the sideways action at the WS1 was the trend being halted at the 88 pips, and instead of correcting, we got a continuation. That continuation took us the next trip of the journey, which was an addiitonal 88 pips to the WS2. Anytime a continuation ensues, you can expect a bounce to the previous level, which in this case is the WS1 at 1.3060. At that point, it is decision time for the pair. Either it resumes the DOWN, or it continues UP.
The circled part also represents the trend's range. That correction also went 88 pips (99, actually). After the bounce from the completion the candle finished under the WS1, a sure sign we are headed to WS2.
This is why say that when I constructed my S&R's it was not only for a support or resistance, but also to give me an idea of the range for any given time period. As long as it is all accurate, it adds a predictability for future moves.
I believe this is the way a successful methodology operates. Mine measures corrections within trends via TF's. The Elliot Wave (EUR/USD Elliot Wave) measures it within the same context. Elliot Wave is based on TL's and Fibos. Mine is based on strictly my S&R's.
By next year, we should see some of the pairs start hitting the decade's S&R's. That is really going to be fun. Of course, I will monitor such activity and keep everyone posted.
 

Attachments

  • eurchf 1hr.png
    eurchf 1hr.png
    39.4 KB · Views: 145
Thanks for the explanation 4xpipcounter.
Bit difficult to follow it as I don't know much about the clouds. It seems like a good system (judging by your success) and I'll do some studying if I can find a nice book (or on the internet)
Best wishes

I have a very good Ichimoku e-book I will email you if you would like to have it.

Regards,
Dave
 
Re: A common S&R trait

Now that 1.3060 has been hit, it is decision time. It struggled around that mark a little, and then it continued to the DR1 1.3069, where it got stopped in its tracks. With this type of price action, most likely what is to follow will be a bounce off the DR1, and then a pattern of continuation that will lead us to the DR2 at 1.3101. At that point, we could see a another pullback as the pair builds a base for what is going to be a huge move UP.
I'm not saying that will be exactly the way action will unfold, but I still expect another pullback in order to form a base and solid launching pad.


This is a common S&R trait. Attached is a chart of the EUR/CHF. First, notice how price action straddled the WS1, then broke away, and then their was a continuance of closes under the WS1 line. What this means is the next stop is WS2. If this seems like hindsight, don't forget how my personal view changed concerning it after momentum gave out after its rise. Also, hindsight has to be used in order to show examples.
The WS2 at 1.2972 was hit, as the low was actually 1.2971.
Mnay times I aluded to how my S&R's help in determining a trend's range. WP--WS1--WS2 is an equi-88 pips. This means that for this week the EUR/CHF's range is 88 pips. What we saw with the sideways action at the WS1 was the trend being halted at the 88 pips, and instead of correcting, we got a continuation. That continuation took us the next trip of the journey, which was an addiitonal 88 pips to the WS2. Anytime a continuation ensues, you can expect a bounce to the previous level, which in this case is the WS1 at 1.3060. At that point, it is decision time for the pair. Either it resumes the DOWN, or it continues UP.
The circled part also represents the trend's range. That correction also went 88 pips (99, actually). After the bounce from the completion the candle finished under the WS1, a sure sign we are headed to WS2.
This is why say that when I constructed my S&R's it was not only for a support or resistance, but also to give me an idea of the range for any given time period. As long as it is all accurate, it adds a predictability for future moves.
I believe this is the way a successful methodology operates. Mine measures corrections within trends via TF's. The Elliot Wave (EUR/USD Elliot Wave) measures it within the same context. Elliot Wave is based on TL's and Fibos. Mine is based on strictly my S&R's.
By next year, we should see some of the pairs start hitting the decade's S&R's. That is really going to be fun. Of course, I will monitor such activity and keep everyone posted.
 
Status
Not open for further replies.
Top