S&P 500 weekly competition for 2012

Have noticed I'm the only one saying down out of the top eight on the leader board. Tactically, I probably should have gone with the others as at least I'd get a point then if one of those seven wins, but I didn't like the key reversal day last Wednesday and other factors I look at are looking more dodgy. Oh well, it could be the end of my run if I'm wrong.

Looks like you are right . Unless it's just a fake run down the hill.
Early days. I may have put the keybosh on it just by mentioning it tho !
:LOL:
 
Looks like you are right . Unless it's just a fake run down the hill.
Early days. I may have put the keybosh on it just by mentioning it tho !
:LOL:

I anticipate a run down to 32-36 area to test for value, bounce back up to 68 area and then a sleigh ride down.
 
I anticipate a run down to 32-36 area to test for value, bounce back up to 68 area and then a sleigh ride down.

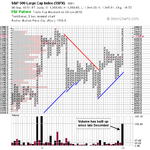
The short term has turned negative, but the medium to long term outlook looks very bullish still imo. I like to note the volume of a move using the P&F charts as a serious move has a consistent build in volume which as you'll see from the below chart, this move does. So I think this is a correction in a bull move that will shake the weak hands out and then resume the bullish run imo.
 

Attachments

  • SPX_PnF_6-3-12.png
    SPX_PnF_6-3-12.png
    18.1 KB · Views: 157
The short term has turned negative, but the medium to long term outlook looks very bullish still imo. I like to note the volume of a move using the P&F charts as a serious move has a consistent build in volume which as you'll see from the below chart, this move does. So I think this is a correction in a bull move that will shake the weak hands out and then resume the bullish run imo.

I was having a conversation with hwsteele about this. I see no real evidence of buyers giving up the ghost yet but I do see price in an area that has historically been for supply so am interested in what it does when it returns back up to the highs.
 
Everyone enjoy the pullback ?

You might be right, but it is Nonfarm payrolls and U.S. international trade data tomorrow, so personally I'm staying neutral on the short term direction until that's out of the way and we manage to get a weekly close above last years high of 1370.58 on the cash as, as you can see from the below volume data for the S&P 500 ETF, Nasdaq ETF and Russell 2000 ETF, the large players volume took a hit, especially in the Russell 2000 small caps and hasn't recovered with the price action which isn't a great sign imo. So I'm going to take the cautious path until direction looks less foggy.

attachment.php

attachment.php

attachment.php
 

Attachments

  • SPY_ev-1.gif
    SPY_ev-1.gif
    12.9 KB · Views: 494
  • QQQ_ev-1.gif
    QQQ_ev-1.gif
    12.8 KB · Views: 508
  • IWM_ev-1.gif
    IWM_ev-1.gif
    13 KB · Views: 495
Last edited:
Interesting on the russel. I was long TZA all last week and up to the big down day this week and I had wondered why it was performing so well.
 
You might be right, but it is Nonfarm payrolls and U.S. international trade data tomorrow, so personally I'm staying neutral on the short term direction until that's out of the way and we manage to get a weekly close above last years high of 1370.58 on the cash as, as you can see from the below volume data for the S&P 500 ETF, Nasdaq ETF and Russell 2000 ETF, the large players volume took a hit, especially in the Russell 2000 small caps and hasn't recovered with the price action which isn't a great sign imo. So I'm going to take the cautious path until direction looks less foggy.

]

So little action from the small players ? Surprising
 
So little action from the small players ? Surprising

Not much in the Russell from the looks of it as have stayed flat this week, but the small players look keener than the institutions this week in the S&P 500 ETF, whereas the institutions look keener than the small players in QQQ Nasdaq ETF.

The charts come from effectivevolume which is a site by a guy called Pascal Willain who came up with a way of separating the volume data a few years ago on a minute by minute basis and now has a automated system that trades using it. He has a book called "Value in Time" which explains it in detail and how to use it. I found it a hard read, but the concept is good and I look at the free charts on his site regularly now as is another tool.
 
W/E 9th March - Results

What a week. A sell off that had the 'downs' thinking it was their's then 3 days worth of buying again with some high volumes, some Greek debt swap wobbles and finally an NFP that was better than expected but failed to push S&P to any new highs, finishing on 1370.87

So with all that, this week's handsome threesome are:

1) Weighted Average - 1372.5 (1.63)
2) robster970 - 1374 (3.13)
3) bodavula - 1378 (7.13)

Seems like many heads are better than one this week then so well done everybody.

Now then, the race for the leaderboard gets interesting as isatrader blows it this week allowing the weighted average to join him in equal 1st place with me 1pt behind in 3rd.

There are only 3pts separating the top 6 here so I reckon this could be anybody's as we round the final corner into March contract expiration week.

Full result here in the spreadsheet
 

Attachments

  • SPWeekly20120309.png
    SPWeekly20120309.png
    128.1 KB · Views: 184
Last edited:
I know that everyone eagerly awaits my prediction and this week I'm going bull (so should be a big sell off). 1389 close.
 
Good stuff Rob, and congrats to the winners! Interesting that the average should outperform most on most occasions. Just goes to show how difficult it can be to beat the market!

As for me, barely above the average in my overall performance -- feels like where I am now in my trading. Just staying afloat.

For next week, I think we're in for a dip. Not an armageddon, so I'll settle for 1345~50 holding through.

So, 1347.5 for next week, please.
 
Doh! Was fracking negative with 5 minutes to go. :sick:

That was pretty unlucky my friend. I was watching it for about the last 15mins and I was thinking it was going to sell off to make it a 'down' rather than 'up' week.
 
So, I'll pitch in my view for next week.

1310

I think she's going to roll over now.
 
Best not, I was short up til -15 on Tuesday, went long. Finished week up 10%, not bad for a flat week. Now I'm fully bull tho and want 1380s before loading back on TZA.
 
That was pretty unlucky my friend. I was watching it for about the last 15mins and I was thinking it was going to sell off to make it a 'down' rather than 'up' week.

The shorts bottled it in the last few minutes and covered and we got a closing weekly high above last years high of 1370.58 which is bullish, but it's the first week the S&P 500 hasn't made a higher high week on week since mid December which is bearish, so I can't make my mind up yet as the price action is completely confused.
 
The shorts bottled it in the last few minutes and covered and we got a closing weekly high above last years high of 1370.58 which is bullish, but it's the first week the S&P 500 hasn't made a higher high week on week since mid December which is bearish, so I can't make my mind up yet as the price action is decidedly confused.

So I'm quite heavily short for real now. Been scaling in this week. I think retail is bullish and commercials have been selling into them. SP contract volumes for Tue & Wed were v.high
 
I'm going to join you, as I noticed the change in my portfolio this week with the leadership thinning out, and because of that fewer stocks are now doing the bulk of the heavy lifting for me.

So 1340 for me please Rob
 
Top