You are using an out of date browser. It may not display this or other websites correctly.
You should upgrade or use an alternative browser.
You should upgrade or use an alternative browser.
Dentalfloss
Legendary member
- Messages
- 63,404
- Likes
- 3,726
asap.please
bbmac
Veteren member
- Messages
- 3,584
- Likes
- 789
As a result of some emails/pm's in response to my post on see-saw divergence, i hope the following maes it clearer.
There are 2 main types of so-called See-Saw divergence. Both deal with Lower highs or Higher lows, ie potentially the very start of a new trend. They can be used on any time frame, from your trigger or a longer time frame confirming set-up and like all tech analysis tends to be, they are more reliable the longer the time frame. I use them in conjunction with other confluential technical factors, not in their exclusivity.
The first type of see-saw divergence is
Regular see-saw divergence.
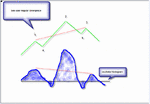
See the screenshot, price makes a high at point 1, pulls back to point a, before a new high at point 2. At this point there is no regular divergence between the oscillator peaks 1 and 2 (although the oscillator could be at an extreme reading at point 2.) Price sells off the new high at point 2 before making a low at point b, (still above or equal to the previous high at point 2, and now buys off that higher low at point b to make a lower high at point 3. Point 3 is higher than the point 1 although the oscillator is lower than at point 1. This is the regular see-saw divergence.
Point 3 could of course be the bottom of a resistance zone and on the next time frame it may well be that price spiked up to point 2, now finding resistance at the body of the candle at point 3 or just in that resistance zone /area at a lower high...the lower high or higher low being a calssic sign of a potential weakness in the prvailing trend.
Obviously this is a lower high example in an uptrend.
The next post will deal with Hidden (reverse) see-saw divergence.
Attachments
Last edited:
bbmac
Veteren member
- Messages
- 3,584
- Likes
- 789
Ok on to the second type of see-saw divergence:
Hidden (reverse) see-saw divergence
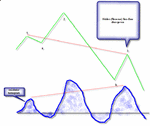
See screenshot: price makes a high at point 1, sells down to point a, before a new high at point 2. Sells off point 2, taking out the previous higher high at point 1 and the higher low at point a, indicating that the trend may be over on that time frame. Now it attempts to go long again off the lower low on that time frame at point b, (incidentally, most likely in the last but one potential RBS zone on that time frame if it is coexistant with the next time frames last potential RBS zone.) and now makes a lower high at point 3, most likley around the previous higher low of the uptrend (point a.) now acting as resistance.
The oscillator at this point 3 is now higher than it is was at point 1, (the last higher high of the uptrend.) This is Hidden (reverse) see-saw divergence.
I will explain and give examples of the final type of divergence, that of so-called over-under divergence, soon.
Don't you just love divergence?? Lol.
Attachments
bbmac
Veteren member
- Messages
- 3,584
- Likes
- 789
Again in response to some confusion about band/channel deviation/extreme deviation.
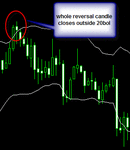
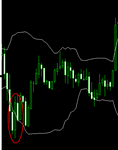
Examples 1 and 2 below show where a whole reversal candle has closed outside the 20bol...this is extreme deviation. It can be a good reversal signal when used in conjunction with support/resistance and oscillator extremes/divergence.
The 3rd example shows where a reversal candle straddles the bollinger band, and again the above applies. This is deviation.
for these purposes Channels/bands like the 20bol should be on settings that contain most price action. It follows therefore that any deviation of price outside of the channel will more likely than not result in a snap back inside the bands/channels at some point, hence creating a potential technical trading edge when used with other confluential factors.
Hope this helps.
Attachments
bbmac
Veteren member
- Messages
- 3,584
- Likes
- 789
over/under divergence
The link is an article in the NQoos group on the subject. i will add more when I have time.
under/over divergence setup ................. NQoos
The link is an article in the NQoos group on the subject. i will add more when I have time.
under/over divergence setup ................. NQoos
Dentalfloss
Legendary member
- Messages
- 63,404
- Likes
- 3,726
over/under divergence.i read trading-naked.what is the setup with osma and macd.?
Dentalfloss
Legendary member
- Messages
- 63,404
- Likes
- 3,726
bbmac
Veteren member
- Messages
- 3,584
- Likes
- 789
The screenshot shows the bulk of price action today Weds 5th Dec 07 in gbpusd.
A typical albeit strong/lengthy intraday trend really,...typical in that it was imperfect. Ie: it was composed of perfect re-entries from SBR areas, re-entries that fell short of the last SBR Area, finding resistance instaed at fibs/broken bids etc, and entries that found resistance at a confluence of fibs/broken bids and in the last 5 (/15min) SBR area. There were 5min reentry set-ups (timed as a 1min Reversal set-up) and 1min Reentry set-ups during the trend at the potential SBR areas.
The asian session 0549-0613 broke to the downside and following a retrace up off 0535 area back into the range, found resistance in the range at the then 38.2% of the intraday move so far.
A break of that lower swing high exceeded the lower swing low at 0535, retracing back off the new lower swing low at bids around 0450, making a lower swing high at the then 23.6% fib of the intraday move around offers at 0480/85 area. 0448-0485 becomes the last 5min SBR zone, coexistant with the last 15min SBR zone.
This lower swing high at 0485 area resulted in a new lower swing low at 0400 level, selling through reported bids at 0420. This pullback found resistance short of the last 5min potential SBR zone at the broken bids 0420, resulting in a lower swing high here selling down to a new lower swing low at 0350 bids. 0400-0420 area becomes the new 5min potential SBR zone.
A strong pullback up off 0350 support finds resistance at the now 23.6% fib of the intraday move /broken offers around 0400/10 in that last 5min potential SBR zone...resulting in 3 tests of the 0405 area, before sellin down to a new lower swing low at 0316 off this lower swing high. 0350-0404 becomes the last SBR zone and is coexistant with the last SBR zone on 15min.
A pullback off this new lower swing low at 0316 results in a lower swing high just below this last 0350-0404 SBr zone, making a lower swing high at the Weekly S2 pivot at 0343. 0350 area was a major 4hr swing low, so was always likley to provide resistance from an underside test. 0316-0343 becomes the new SBR zone.
Price sells off this new lower swing high making a lower swing low at 0300 level support. A pullback off 0300 support finds resistance in the last SBr zone at 0330 making a new lower swing high before selling down to further support for a new lower swing low at 0297. 0301-0330 becomes the SBR zone.
Price reatraces off 0397 finding resistance in the last SBr zone at 0327, making a lower swing high there before selling down to a new lower swing low at 0273. 0397-0327 becomes the new SBR zone.
Price retarces off the new lower swing low at 0273 to make a new lower swing high in the last SBR zone at 0301 before selling down to make a new lower swing low at 0268, from here price sells down off lower swing highs at 0288 and 0287, both times in the last SBR zone as slightly lower lows and lower swing highs are made on each occassion in the new SBR zones.
Finally, (at time of writing) Price retraces off a new lower swing low at 0252 finding resistance in the last but one 5min SBr zone at that 0301 area SBR again.
Attachments
Dentalfloss
Legendary member
- Messages
- 63,404
- Likes
- 3,726
good analysis.lets have more
bbmac
Veteren member
- Messages
- 3,584
- Likes
- 789
I thought I'd add a few thoughts to refresh this thread:
The discussion assumes an intermediate time frame, a higher trend time frame, and a lower trigger time frame: (eg: 5min intermediate, 30min trend time frame, 1min trigger, are mine, but any sensible combination works 15min 1hr 4hr for eg...)
Re-entry set-ups and their application.
We know that Re-entry set-ups occur after a pullback and are best acted upon at identifiable areas of broken Support that has the potential to become Resistance (SBR) in a downtrend, or broken Resistance that has the potential to become Support (RBS) in an uptrend, with entry timed by a set-up on the chart below.
Ie: You should be able to identify potential SBR/RBS on the intermediate chart if acting upon a trigger chart Re-entry set-up. Similarly you should be able to identify potential SBR/RBS on the trend t/f chart if acting upon an intermediate t/f Re-entry set-up (timed as a trigger chart Reversal set-up.)
Trigger t/f Re-entry set-ups tend to occur after a fairly shallow pullback whereas Intermediate t/f Re-entry set-ups occur after a deeper pullback.
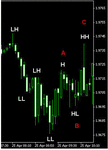
The example below (pic 1) illustrates an important phenomenon that should be borne in mind if acting on a Re-entry set-up.
The 5min intermediate chart and 30min trend time frame charts were in a downtrend.
The 5min chart shown above illustrates the phenomenon; Price is in a downtrend and makes a Lower Low [LL] at 9675, re-tracing to a High (H) at point A, above the last LH of the downtrend, ….selling down from that High at point A, again with the prevailing downtrend but failing to make a new Lower Low (LL,) instead making a Higher Low [HL] at point B before making a Higher High [HH] at point C.
At point A there existed a Re-entry set - up on this 5min intermediate time frame and at point C there existed another Re-entry set-up on that time frame.
The fact that this intermediate time frame was now in a weak uptrend at point C meant that although the set-up remained high probability to capture pips, the chances of price going on to make a ‘with down trend follow thru’ to new lows below the 9675 current Lowest Low s were lessened because the re-entry to the downtrend at point C did not fall at LH on both this intermediate chart and the trend time frame chart.
Pic 2 below shows the 5min intermediate chart Re-entry set-ups at points A and C; (These are the set-ups I use but they can be be whatever method you determine is best to re-enter a trend at potential sbr/rbs)
Both these set-up produced pips (20 and 30pips max respectively.) Acting upon them remained a high probability trading opportunity for pip gain as the 30min trend t/f was trending down....as shown in pic 3 below;
continued in next post....
Attachments
Last edited:
bbmac
Veteren member
- Messages
- 3,584
- Likes
- 789
The essential Price action observation is this:
Any time frame Re-entry set-up remains a high probability set-up for pip gain if it appears at a point that is still a Lower High (LH) in a downtrend (or Higher Low HL in an uptrend) on the higher trend time frame, It may however not result in a with trend follow thru to a new Higher High in uptrend / Lower Low in Downtrend if it does not set-up at an immediate LH / HL on the lower t/f on which it appears (like it has on the higher trend time frame.)
This said like in the example above the chances of the 5min intermediate Re-entry set-up at point C achieving a with 30min trend t/f follow thru to new Lows are lessened, because the intermediate chart (5min) is now in a weak uptrend, and this must be borne in mind re targeting. (ie This is not to say it can’t and does happen but it is so advise that the more probable expectation, and particularly in the absence of any ‘with trend’ momentum, should be for a modest pip target falling short of the with trend follow thru.)
It follows therefore and certainly is my experience of price action observation in this respect across an extended sample that the highest probability of price achieving a new Higher High (HH) /Lower Low (LL) for a continuation of trend, above/below the Highest / Lowest point at which price began to retrace to create a Re-entry set-up on the t/f below is if;
The Re-entry set-up appears at a Higher Low (HL) in an uptrend or Lower High (LH) in a downtrend; this on both the t/f that the set-up appears on and on the higher t/f whose trend such a set-up indicates a re-entry to. (Ie: not at a H or HH in a downtrend or L or LL in an uptrend, on the time frame where the re-entry set-up appears.
For example, using the chart below (pic 4) as price began to trend up strongly making a High (H) on the 30min trend time frame above it’s last Lower High (LH) and LL of the previous downtrend
Price retraced off the High (H) making a Higher Low (HL) at Point A shown above.
This Higher Low (HL) at point A saw a Re-entry set-up on the 5min intermediate chart (timed as a 1min trigger Reversal set-up.) at a HL on that chart as well as the 30min trend chart into whose trend the set-up was indicating a high probability entry....see pic 5
The set-up went on to see a slightly Higher High (HH) than the High (H) before the retrace that gave rise to the Re-entry set-up at the HL discussed above. ...see pic 6
(This was before clear Reversal set-ups appeared at that HH at point X shown on the chart below, extending to the 15min chart. )
Attachments
Last edited:
Similar threads
- Replies
- 8
- Views
- 6K
- Replies
- 11
- Views
- 8K

