Re-entering a trend

Price retracing further off that 0190 area following support found at 0151 that took out the last higher swing low of the uptrend at 0156. Price retracing to a lower swing hi at 0170 now exceeding that 0151 lower swing low to record a new lower swing low tstill selling at 0141bid as I type this. The new SBR zone of this '2nd' short trend of the day, on the 5min intermediate therefore becomes the last lower swing high at 0170 to the last lower swing low at 0151,...but really as price is still within the intraday hi-lo range you could argue that both the intermediate and longer time frame 5[ 5 and 30m in my caee] is now in a range, so caution must be excercised at this stage as to re-entries to anything, Lol.

Remember too that during the uptrend from the 01016 lows, there had not been a higher swing high on the longer time frame, so as cautioned earlier, the re-entries werelower in probability as effcetively the only long trend you were entereing was the intermediate, not the longer time frame (in my case 30min.)
 
hmm, sums it up 🙂 cut that long 2.0161 at 2.0156 -6, got a signal to roll short. Funny enough also same time on GBPJPY so taken a short from 232.79.

But looks like cables gonna attempt to flop lower from here on.... lets see what happens, but my charts say downpressure on again.....
 
Thursday, .....cable breaks the asian 0136-0175 range making a higher high at yesterdays high area of 0216 before retracing to 0195 area....finding support there before making a new high at 0145. The RBS zone thereffore becomes the broken higher swing high at 0216 to the higher swing low at 0195. The retrace off 0145 highs finds support at the lower end of that 0195-0216 RBS zone, at the 38.2% fib of the intraday lo-hi move and then makes a new high at 0251 area. The new RBS zone therefore becomes that broken higher swing high at 0245 to the new higher swing low at 0205 area.

Potential Resistance lies at the 0250-75 area ahead of 0300
 
Last edited:
Thursdy cont....

A small retarce at the base of that 0250-75 resistanbce zone to a new higher swing low at 0235 so the new RBS zone becomes 0250-0235, price now finding resistance at the top of this resistance zone, as I type this.

I have Reversal set-ups up to 15min chart (seperate subject) so wouldn't be surprised to see a fair pull back at some point, though I'm struggling to identify what the resiatnce is other than Dly r2 pivot at 0272, a 61.8 fib (0652-9651) at 0273, 176.4% fib extension of yesdterdays range at 0277, and of course there is the Daily Res T/line at 0283 from 24/7... here in what is however a very bid market intraday, with U.s data due up at 1330pm london time.
 
Last edited:
So cable makes a new high at 0284 finding resistance at that Daily Res T/line, as mentioned in above post, the new highs making 0256-0243 then 0270-0255 the new RBS zones on the 5min inetrmediate chart. The resistance and reversal set-ups to 15min are strong enough to see a deeper retrace/pullback taking out that last 0270 higher swing high and 0255 higher swing low on the 5min intermediate chart, before finding support at the broken highs at 0243/45 area which was the last RBS zone on both the 15 and 30min chart.

This is the 2nd hit of this trendline causing resistance although the first on Monday failed to result in any significant swing lows being exceeded. Should this 2nd hit and hold result in this week's lows at 2.0085 being taken out then the overall longer time frame situation may turn bearish, with the last significant swing low on the daily chart being at 9877 area, that low joined with the low on 17/8 forming an upward sloping suppoort trend line on the daily.

Enough for today, I'm done.
 
The screenshot is of the daily Gbpusd chart and shows the resistance and support t/lines referred to in above post.
 

Attachments

  • daily.gif
    daily.gif
    26.6 KB · Views: 223
The screenshot below shows the RBS zone on 15min referred to in post 25 above. Ie the higher swing highs at 0243/45 area(A) and the higher swing lows at 0204 (B.) You will see that although the retrace down from the daily trend line took out the last 5min RBS zone as decsribed above, price found support at the top of this 15min, the next time frame's RBS zone (C.) Ie those broken highs that contained the price in the london morning session.

Price makes another attempt higher from that RBS before the U.s Housing data kicked in at 1500pm London time and the reaction sell off from a lower high resulted (D.) but again found support in that RBS zone
 

Attachments

  • 15min rbs zone.gif
    15min rbs zone.gif
    14.6 KB · Views: 204
Last edited:
The screenshot shows todays uptrend on the 5min chart. You will see that the rtrace down from the 0376highs (which was the 161.8 fib extension of yesterdays range, as well as Wkly M4 area and 31/7 Hi)..... has broken the last 5min RBS zone and as yesterday is currently in the last but one, which is also the last 15min RBS zone.
You can see that price did make another attempt to take out the highs in the first 5min RBS zone before failing at a lower high on that 5min chart.

My point is this: On any deeper pullback if the first intermediate RBS / SBR zones are taken out on a retrace, look for the last RBS / SBR zone zone on the next time frame up to find a set-up. Of course whether that set-up results in a new high depends on whether the support/resistance above being a major swing point or not, but for intraday players like myself they still represent an opportunity to gain pips.

Although I use this 'nect' time frame of 15min you can, in this respect in keeping with the Elder triple time frame use the longer time frame which for me is 30min. Very often the 15min RBS/SBR zones match the 30min anyway.

As I type this price has indeed found support in that 15min RBS zone at 0320 and currently trades at 0360.
 

Attachments

  • 5min.gif
    5min.gif
    13.9 KB · Views: 182
Last edited:
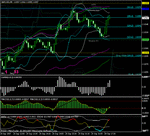
The screenshot is my main 5min chart (intermediate) and you will see that the type of technical re-entry set-ups I favour on this chart involve both hidden/reverse oscillator divergence coupled with some band/channel deviation, in this case price deviated from the 10 (aqua) and 20 (white) bol. The higher of these 2 set-ups occured in the RBS zone discussed above in post 28.
 

Attachments

  • 5min.gif
    5min.gif
    21.9 KB · Views: 190
I forgot to mention that the support that price found in that 15/30min RBS zone was the previous Weekly High that had held since Monday...always worth noting the major swings that fall in your RBS/SBR zones, dependent on what time frames you are trading.

Price making a new Daily/Weekly High as i type this. The Monthly High at 0366 area having been exceeded now, the August high at 0462 area becomes a target for the posotion/trend followers I guess.
 
Price finding some minor resistance at Dly R2 pivot 0385 that coincides with the first Weekly camarilla target of H4 following the H3 breakout.

Potential Resustance to the upside now resides at 0400 (176.4% extension of yesterday at 0398) area followed by 0417area the 78.6% retrace of the fall from 0652-9651, followed by 0450/65 area.
 
So, Price continues higher on gbpusd, finding that resistance at both 0400 and 0416 area but overcoming both to press new highs at 0448 level just below that 0450/60 'medium offers' mentioned by Mni, highlighting the August highs around that area of 0460-65.

Notice how the retrace down from the 0400 resistance found support at the top of the broken 0376 highs, forming the 0376-0320 new RBS zone on 5min intermediate and 15/30min at the time, the 0320 being the broken Weekly high from Monday.

A decisive break above the Daly Res trend line from 24/7 spurred no doubt by the generally $ weak us data lately, the core pce today showing the weakest core inflation since feb 2004.

I wonder whether the BOE/Mpc will heed the Ft's advice today re next week's rate decision and cut rates? Should be an interesting week.

Enough from me for this week.
 
The screenshots show 2 custom indicators that may be useful to some.

'sessions' shows the asia/european/U.s forex sessions and where they overlap and is adjustable. The 2nd screenshot is an indicator that marks the current and previous Daily, Weekly and Monthly Highs and also contains the Dly,Wkly and Mthly pivots, although I have them turned off on the screenshot. The indicators are in the zip file.
 

Attachments

  • sessions.gif
    sessions.gif
    17.3 KB · Views: 194
  • previous & current levels.gif
    previous & current levels.gif
    15.8 KB · Views: 209
  • indicators.zip
    indicators.zip
    5.4 KB · Views: 116
Friday push up

hi bb,
Thanks for your commentaries, which I find really useful. I started the Friday session looking for shorts, on the premise that the overnight trend on the 30 min had been down. The break of the 250 level with feeling put me right about that. At what point did you consider the 30 min trend had changed back to up? Is it the 295 to 260 area, using your peak and trough identification? And does that mean, that you did not start to look for longs until that point? Or will you take a long earlier based on the fact that momentum is subjectively upwards. Looking today, I needed to go back to the 4 hour to find where the low of the candle remained in the previous rbs zone (217 to 106).

And thanks for posting the indicators..
 
Hi Fish, thx for the comments.

Interesting question you raise. The asian session sell off from the 0297 meant that that high was the last significant swing high on 30min so a new long trend using the 1/5/30min chart configuration wasn't in place until that 0297 last swing high had been exceeded.

Using London times on the 30min chart, the 930am candle found resistance at that asian highs area of 0295 , retracing down from these equal highs to the 0260 area. This equal high and higher swing low became a weaker RBS zone on that chart as the 11am candle broke through to form a new high at 0326. The retrace down from that 0326 area indeed found support in this equal high - higher low 0295-0260 RBS zone at the 0290 before the next leg up in the trend, taking out the new 0326highs.

So the point is that strictly speaking until a new swing high had been created if using the 30min as the longer time frame, in the triple t/f configuration, you were only re-entering trends that existed on time frasmes below this 30min, but the 9am bullish thrust candle on the 30min gave a positive indication that the trend had momentum.

Re-entering a trend ton your longer t/fthat is weaker than the classic higher high/higher lows in an uptrend example is therefore more risky. In these situations you can always use a lower volume/risk, unless you are convinced that the trend is good.
Another clue as to the liklehood of trend continuance is the last daily candl;e, and in this case a Bullish thrust had engulfed Wednesday's Bearish spinning top.
 
Last edited:
Monday

Cable makes an early london session high before breaking to the downside through the asian range lows of 0438 (0486 highs.) Price makes a low of 0433 before a retrace back into the asian range , finding resistance at 0453. This Lower low and Lower high on 5min becomes the first SBR zone. The RBS zones as the short trend develops then become: 0435-0452, 0417-0425, 0407-0420, and 0404-0416, as I type this.

Price currently finds support at the 23.6% fib (0398) of the move up to todays highs from 0085, last week's lows. The 15/30min potential SBR zone becomes 0425-53, so watch for Resistance in this zone on a deeper pullback above 0398.
 
Price finds resistance in that SBR zone to sell below the fib support mentioned above making the new SBR zones on the subsequent moves, 0398-0412, and then 0382-0400.

The retrace up from the 0378 area ( a swing high on friday) has seen the first intermediate (5min) SBR area exceeded, ie it's upper point, the 0400 lower swing high has been exceeded. When this happens it is best, as previously discussed to look at the next time frame's SBR zone and see whether you get a set-up in that.
 
As mentioned above, the deeper retrace does indeed find resistance in the next time frame up's own last SBR zone, ie the 15/30min's which is that 0424-0453 area, first at 0440 then at 0446, but has yet not made a new low below the current 0376 Daily low.

MNi confirmed that offers resisded now in that region, and the early london session update gave the area 0435-50 as bids, so it was an obvious area of SBR.

A break above this SBR zone probably opens up the Daily highs again as a technical target.
 
You can see this 15min SBR zone in the screencap and how price is currently struggling to break north of it, despite a strong recovery off the 0376-78 lows.

Point A - B is the SBR zone and point C is where price is re-testing the area following the depper pullback.
 

Attachments

  • 15min.gif
    15min.gif
    12.7 KB · Views: 166
So arelatively subdued London session today in cable, 116pip Hi - Lo range compared to friday's 293pips, which dragged the already high daily averages up to 162 (5day) 178 (10day) and 151 (20 day.)

The Daily low so far at 0376 area being the 38.2% fib of the move up from friday's lows to todays highs (0195-0492 areas) has held since hit as has the 0450 area, that has acted as resistance on the recovery from the lows.

Currently the 5min channel is 0414 - 0447 both of which have been hit and held twice, as price consolidates in this narrow range at the end of the london/European session.

Price remains bullish, but any close under Friday's lows would surely dent the underlying trend.
 
Back
Top