Ratman's beginner's set up and analysis

@ fordeog i think he means a continuation in the downward trend between 11th and 16th mar

I dont think thats tradable analysis myself. I'm thinking convergence is more likely whilst the euro decides what do while trading at this high level aginst sterling. :-S

May well have done, sorry if i was wide of the mark then.

I just said what i saw, and if you were implying that what i said wasn't tradable analysis then so be it but what you've written seems to agree with me.

Do nothing unless it goes back up or goes down.
 
any ideas?

Hi Aaron,
You might like to try Interactive Investor International. They have been running a promotion where you get £100 to trade with when you sign up and you can trade at 10p a point. The £100 has no strings and you don't have to deposit funds to get it. Any profits you make on the back of it you keep.
Just a thought?
Rob
 
May well have done, sorry if i was wide of the mark then.

I just said what i saw, and if you were implying that what i said wasn't tradable analysis then so be it but what you've written seems to agree with me.

Do nothing unless it goes back up or goes down.
I only meant I think thats the pattern he was on about 😛
 
Long story shot I'm thinking this is a test of 147 level and I'm shorting above1473 for short term trade....

Anyone else have opinions?

Target - 1463 7am trading low for today but still above 61% daily fib

Quick glance of the 30 min chart i would say


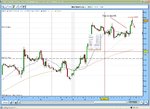
It's gone up to highs and rebounded off, gone down and traded in a small range for a few bars before breaking to the upside, could've been a good buy there just above that channel, but if it fails to go through the resistance then it may well crap out but sincethe general trend is up then it would be more likely to go up.

ps far to many lines on that chart for me, were all the ones in the middle meant to be S/R line?

s/r is generally at highs&lows not at the bottom of every candle
 
Hi Aaron,
You might like to try Interactive Investor International. They have been running a promotion where you get £100 to trade with when you sign up and you can trade at 10p a point. The £100 has no strings and you don't have to deposit funds to get it. Any profits you make on the back of it you keep.
Just a thought?
Rob

Do you work for these people?
Whats the catch?

lol
 
Do you work for these people?
Whats the catch?

lol

Haha - you've caught me out!! No - I don't work for them. I signed up to a few weeks ago and it's been fine. I'm not really in a position to say who the best SB firm is because I don't know. I have accounts with iii, FS and IG. IMO IG are def for charting but who'd want to turn down a free £100 to trade with. I've recommended iii to a few people and no-one's had any problems.
Rob
 
Quick glance of the 30 min chart i would say


It's gone up to highs and rebounded off, gone down and traded in a small range for a few bars before breaking to the upside, could've been a good buy there just above that channel, but if it fails to go through the resistance then it may well crap out but sincethe general trend is up then it would be more likely to go up.

ps far to many lines on that chart for me, were all the ones in the middle meant to be S/R line?

s/r is generally at highs&lows not at the bottom of every candle


Yeh I track S&R quarterly half hourly TF and use fibs at hourly and daily for my trades

I leave all markers on charts

Use fibs and hourly and using close line charts and I then leave those markers when i analyse candles lol It looks a bit messy I know
 
Spread betting?? I'm muslim... I'm not supposed to gamble. Thats why I only really use CFDs at the moment. But to be honest I'm not really sure there's a difference.
 
Haha - you've caught me out!! No - I don't work for them. I signed up to a few weeks ago and it's been fine. I'm not really in a position to say who the best SB firm is because I don't know. I have accounts with iii, FS and IG. IMO IG are def for charting but who'd want to turn down a free £100 to trade with. I've recommended iii to a few people and no-one's had any problems.
Rob

Is that a spreadbetting account (not CFD)
If you dont have to deposit anything, im gonna sign up.
Do you need a promotion code?
 
Your comment on the previous candle breaking s/r is invalid in my opinion. If you consdier that line to be a support line then go back along it and see

A how many cnaldes have gone a few pips below it (quite a few)

B how many have gone a load below it? It's not providing much support if the market has traded well below there.

Also don't think of s/r as a fixed price, more as a zone.
there may be a bg buyer at a fixed price but only in lost of little sizes but someone may have sold a lump at best therefore taking below the bid so it very briefly traded below the buyer but popped back up.

hope some of this helps
 
Is that a spreadbetting account (not CFD)
If you dont have to deposit anything, im gonna sign up.
Do you need a promotion code?

Yes - it's an SB account. I simply went on their website and signed up online. Probably best to check that they are still running the promotion but, when I signed up, they called me to say hello, I asked about the £100 which they said would be deposited within 3 working days and off I went 🙂
 
Is that a spreadbetting account (not CFD)
If you dont have to deposit anything, im gonna sign up.
Do you need a promotion code?

iii is a city index platform which in my opinion isnt great, i gave that up along time ago, i trade with 30 others who SB and use CFD's and we use an institutional style platform, give me a shout and ill let you know who to get it
 
Your comment on the previous candle breaking s/r is invalid in my opinion. If you consdier that line to be a support line then go back along it and see

A how many cnaldes have gone a few pips below it (quite a few)

B how many have gone a load below it? It's not providing much support if the market has traded well below there.

Also don't think of s/r as a fixed price, more as a zone.
there may be a bg buyer at a fixed price but only in lost of little sizes but someone may have sold a lump at best therefore taking below the bid so it very briefly traded below the buyer but popped back up.

hope some of this helps

If you look at the last two charts they are both exactly the same... The candleschart is a zoom on the line chart so you can see where the S&R levels came from.

I normally use S&R off close charts then analyse the positions using candles. When I see a candle around the S&R level I've been treating the volumes traded with more reverence than the actual levels traded on the assumption that outlying values traded at sup/res levels have to be taken with a pinch of salt for the exact reason you said in your post i.e. some whizz kid(s) somewhere messing with the market. Look at the convergence then the volumes traded between the two S&R levels at 11 am after seeing the 8am and 10am trading levels
To me the amount of trades is a better indicateor of where the market value really lies

Thats my logic anyway

If its ******** I'm open to being corrected lol.
 
What ya think?

Im expecting at a pull back to the 50 level at the very least ... then we'll see how the news affects things

I'm gonna short and with an order to close at the 50 lev and leave it

Stop at 7890. I think that will be around the next test level- check daily

I need to learn to use those anyway

Nobody else got any trades.... This is boring alone
 

Attachments

  • dj250309.JPG
    dj250309.JPG
    150.3 KB · Views: 152
Back
Top