Ratman's beginner's set up and analysis

Eh?

some people said "go and read some books etc" he said "ignore them and go and read some books"

hence he agreed with them.

don't really see whats negative with that.

Chill out.

Hi Foredog.

Just to clarify, I didn't say "Ignore them" and yes I was agreeing with the others that, reading, studying charts and practising is the best way to learn. My point was that Aaron's idea of having a thread for newbies to discuss potential trades and techniques, and have some of the more proficient traders calling in to tell them what they did wrong and how to avoid it next time, was, in my opinion, a good one. All the newbies discussing and learning together, which is what this website is for is it not? Anyway, I don't wanna get into one of those silly tit-for-tat internet debates! Especially with you as I have a lot of respect for and appreciate your helpfull posts Hope your trading is going well.

Sam.
 
No problems. I agree that it's good for newbies to have a place to post idea without being mocked.
 
Finding those horizontal levels

Aaron,

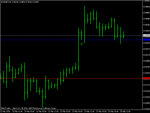
Here's one method for finding those elusive horizontal "pivot" levels.

Look for the following 3 bar pattern:

Short Side
Bar 1: Note the low
Bar 2: Closes below the low of Bar 1.
Bar3: The high fails to pullback as far as the low of Bar 1.

This high often, but not always, corresponds to a historical pivot level, or predicts a future pivot level.

Long Side
Bar 1: Note the high
Bar 2: Closes above the high of Bar 2
Bar 3: The low fails to pullback as far as the high of Bar 1.

This low often, but not always, corresponds to a historical pivot level, or predicts a future pivot level

In the chart attached, EURGBP H4, see how the blue and red lines are good predictors of future pivot levels.

There are many other ways of doing it, but I've found these very effective.

Joey
 

Attachments

  • findingpivots.gif
    findingpivots.gif
    9.2 KB · Views: 195
:-0

you are joking right? Trade the news? OK then here's a task for you; try and figure out the misdirection/deception/collusion involved with OPEC before, during and after its meetings.
Never trade the news, be v.careful of even trading the reaction to the news.

Thats too deep. I'm talking basic news.
 
we can all draw trendlines,but trading is mainly about managing risk.so when you think you have a good entry,expect to lose until the market proves you right.so therefore when you enter try to lose as little as possible,and size your position appropriately.

That was a weekly trend

All time frames are showing there will be some decent action
 
I'm watching this.

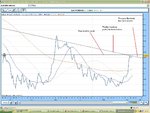
USD has weakened so I'm thinking we're either gonna see a temp rejection of the next level then supp or res at 136694 ish (see daily... this was a support level back in aug 07).

I think this is a safe short at the moment for a short term trade of a day or two.

The hourly is looking more promising since I've been writing this and has hit res at my weekly trend level...

What do you guys think?
 

Attachments

  • Eur-usd.JPG
    Eur-usd.JPG
    157.3 KB · Views: 233
Hourly line is now showing a poss H&S and half hourly candles are showing rejection of trades above my weekly trend line

I'm goin in short on this... stops at 137....

is that a poor stop?

anyone got any ideas on whether this is a poor trade?
 
Last edited:
Any reason why it's *at* 137?

Would personally put it 13740, based on a 3H BEOB but that's just me.
 
Aug 07 rejection level... Daft idea now I think about it. If it approaches 137 chances are it will definately trade above that level...

Thanks dude

Also I'm tring to work on getting stops as tight as possible whilst I'm trading demo.

I dont have 3 hr chart only hourly/daily

wtf does beob stand for?

Bearish outside bar :)
 
Aug 07 rejection level... Daft idea now I think about it. If it approaches 137 chances are it will definately trade above that level...

Thanks dude

Also I'm tring to work on getting stops as tight as possible whilst I'm trading demo.

I dont have 3 hr chart only hourly/daily

wtf does beob stand for?

lol pmsl beob -is a good question got me beat - just ignore me
 
meaning... sellers controlling the market?

I don't see where how you draw that conclusion...

Anyone care to elaborate lol


What TF are you on? I'm only on half hourly, hourly or daily
 
Last edited:
My target is 136220

Second lowest trade of the day...

Is that stupid logic?

I have a problem with trade exits. More often than not, I exit a profitable trade too early.
 
Last edited:
lol

dude you're nothing like him

Take the 1H bar that made today's high, add it to the 2 subsequent bars. That gives a 3H beob.
 
thank f for that lol.


thanks for the 3h info - a big duuuuuh to myself lol

I've already exited the trade :-(

978 margin and 730 profit...
 
Top