Ratman's beginner's set up and analysis

Why is it? The market was being forced. It wasn't really testing levels... 11am-12pm gold drops by $15/ounce. Then lunch time and downtrend stops and selling rally stops. 2pm-3pm gold rises by $19/ounce and settles on the 23% 2 week fib. Market close gold drops $16/ounce and tests out -38% 2 week fib and settles on -23% 2 week before stabilising throughout wall st operating hours.

If you can give me a reason for the why gold fluxuated so much then I'll retract everything but as far as I'm concerned the gold market was coersed yesterday.

and....? You must put all your 'market thinking' and emotions to one side (it's hard, trust me I know). If you'd simply traded the 3-4 major opportunities to make money on gold yesterday and had made money would you 'feel' the same way?
 
Touché

Should have been watching what was happening and not waited for what I was expecting. That's what economists do lol. Thanks guy.

Quick question. You reckon the market pays attention to a crossover of two diff moving averages or you think any action thereafter is a bit of a coincidence?
 
Quick question. You reckon the market pays attention to a crossover of two diff moving averages or you think any action thereafter is a bit of a coincidence?
LOL. Lovely.

There is no "Mr. Market". Any market action subsequent to any MA-X of your choice will be purely coincidental.
 
Touché

Should have been watching what was happening and not waited for what I was expecting. That's what economists do lol. Thanks guy.

Quick question. You reckon the market pays attention to a crossover of two diff moving averages or you think any action thereafter is a bit of a coincidence?

eh?😕
 
Aaron,

A few postings ago, you said this thread had been a total failure.

Early on in the thread there was a posting from Trader_Dante. As far as I could see, you took no notice of it whatsoever. This is a pity, for he knows whereof he speaks. You might have taken a hint and gone and looked at his "Making Money Trading" thread. To save you a search it is here:

http://www.trade2win.com/boards/365767-post1.html

or here:

http://www.trade2win.com/boards/first-steps/26947-making-money-trading.html#post365767


Unless you have already read it of course, in which case, please accept my apologies.
Doesn't look like you absorbed any of its lessons if you did read it.

So you've read Trader Dante's thread and that gives you the right to come in here and talk sh*t to me? Jog on.
Maybe I looked at how TD analysed the chart, took it in, learned from it then decided to let him got on with his trading while I get on with my learning. Did you think of that when your started typing your ludacrisly self aware post?
I said this thread was a failure because no other beginners really come in here to the analysis on our charts and to see whether or not it us into a profitable trade.
I don't need other newbie traders who don't know how to use whereof in a sentence coming and giving me a headache to be honest mate.
How about you post a chart, we discuss it analysis and we learn together. I'd say that's a bit more productive than a slagging match.
 
Last edited:
Eurgbp

I'd like to quickly analyze the EURGBP chart here as I'm sharpening my trading skills.

Attached you'll find a 4H TF chart of EURGBP. My own analysis tells me the following story:
Its in a triangle. Just broke through short term support at 0.9146 level and getting close to next support line.

With recent cable run, needing a pullback, I'm thinking EURGBP might bounce off the support line for short run but then head lower toward .87/86 level as cable pushes higher back toward 1.50.

Alternatively, it might bounce off the support line to break through the resistance line at 0.9146, do short retracement, then head higher toward resistance to breakout of the triangle, test 0.95 level. I'd enter on double bottom of support line.

I think one could entertain a buy off support line with tight stop other side of support line, or wait for break of support line,pullback and short it to nice 200-300 pips toward .87 level.

Or if it breaks through triangle resistance line,wait for pullback and ride it toward .9794 or so. Obviously you could also pre-empt as well.

Few profitable options should present themselves.

I'm a total beginner but have been learning quite a lot over past few weeks when I started getting into forex so trying to put my ideas on paper as it helps me analyze potential profitable opportunities.

Looking forward to input or if i'm sounding totally crazy with my analysis let me know, i'm just trying to analyze what i see taking place - higher lows, lower highs = triangle, extreme support/res. lines, safest trades in direction of the trend.
 

Attachments

  • eg.gif
    eg.gif
    17.8 KB · Views: 288
Last edited:
On the recommendation of Trader Dante, who happens to be a a bit of a legend around here, I trade mainly on the hourly time frame. I'd suggest you do the same so we're all on the same level (assuming anyone else even wants to join in lol).
I don't actually have the patience for daily trades yet and some other members recently made me aware that if you look at hourly bars in groups, you can see action in 3/4 hours too. I know that seems obvious but I was just being fed information by my platform rather than using the platform to find information. Anyway, as I was saying, hourly works best for me. I actually still look at shorter time frames sometimes too but to be honest I don't even enter trades on them any more.

Anyway here's my take

Chart 1 - Where i drew my fib retraction and trend line
Chart 2 - Blank so you can see better without my notes
Chart 3 - My analysis

Hopefully one of the more senior members will notice that I'm talking sense rather than p*ssing people off and/or talking garbage here and will come in and say whether or not we're talking sh*t and/or post a chart of their own. ;-)
 

Attachments

  • fib and trend.jpg
    fib and trend.jpg
    177.4 KB · Views: 261
  • blank.jpg
    blank.jpg
    188.1 KB · Views: 265
  • my analysis.jpg
    my analysis.jpg
    231 KB · Views: 241
If I was you, I would re-edit that post and delete the top paragraph. You complain about not getting any posts in the thread and then effectively tell anyone who uses charts other than the H1 that they're not welcome.

Just my 2c
 
When did I say anyone wasn't welcome. I SUGGESTED IN MY THREAD that all newbies who are going to be learning here together pick the same time frame. I said hourly becasue all platforms provide hourly and not all provide 3/4 hourly. Its uniform. That way when someone comes in to help us it's easy for us all to take in the information.
 
I may not be able to use whereof in a sentence correctly, but I can spell ludicrously 🙂
(And I did offer you my apologies in advance).

Sorry, I didn't mean to slag you off. However, if your trades are as emotional as some of your postings...

I won't post any charts just now thanks, as I'm too busy studying. However, if you can attract some more newbies and get them to post, and post some yourself, perhaps we can talk.

p.s. Definition of 'Whereof'
 
Last edited:
So what was intended to be a nice thread for newbs like myself to learn a thing or two degenerates into flaming and a spelling contest (by the way, people make typos especially if they're in a rush - it happens). Come on guys, how you read what another posts, is not necessarily how they intended it.

Anyway, back to learning. Aaron mentioned about moving average crossovers. While I don't try to enter based on these, it is suggested in certain trend following books that people do use moving average crossovers. So perhaps theBramble or others could explain why it is coincidental. What is the value of moving averages? As support? As an indicator of trend? All comments welcome.

On the EURGBP Aaron. I have a trendline going up from 20Oct 2008. I also have a 38 fib retracement from that swing low to the swing high is sitting on around 9000. Might be a nice entry if it gets down that far. I find trading Forex a bit hard though 🙂
 
Last edited:
So what was intended to be a nice thread for newbs like myself to learn a thing or two degenerates into flaming and a spelling contest (by the way, people make typos especially if they're in a rush - it happens). Come on guys, how you read what another posts, is not necessarily how they intended it.

Anyway, back to learning. Aaron mentioned about moving average crossovers. While I don't try to enter based on these, it is suggested in certain trend following books that people do use moving average crossovers. So perhaps theBramble or others could explain why it is coincidental. What is the value of moving averages? As support? As an indicator of trend? All comments welcome.

On the EURGBP Aaron. I have a trendline going up from 20Oct 2008. I also my 32 fib retracement from that swing low to the swing high is sitting on around 9000. Might be a nice entry if it gets down that far. I find trading Forex a bit hard though 🙂


I'm just going to star ignoring them again... Post a chart if you could. lets have a look.
 
EURGBP Daily chart. The 38.2 Fib from quite some time ago is sitting on the 9000 which could have extra strength just by being a 1,000. I've just seen in the other thread this called as a good sell. Looks a good buy at 9000 to me, and not a sell until it flies through the trend line. I must have something wrong here ...
 

Attachments

  • EURGBP.jpg
    EURGBP.jpg
    117.4 KB · Views: 152
So what was intended to be a nice thread for newbs like myself to learn a thing or two degenerates into flaming and a spelling contest (by the way, people make typos especially if they're in a rush - it happens). Come on guys, how you read what another posts, is not necessarily how they intended it.

Anyway, back to learning. Aaron mentioned about moving average crossovers. While I don't try to enter based on these, it is suggested in certain trend following books that people do use moving average crossovers. So perhaps theBramble or others could explain why it is coincidental. What is the value of moving averages? As support? As an indicator of trend? All comments welcome.

On the EURGBP Aaron. I have a trendline going up from 20Oct 2008. I also my 32 fib retracement from that swing low to the swing high is sitting on around 9000. Might be a nice entry if it gets down that far. I find trading Forex a bit hard though 🙂


Indicators are lagging the most important indicator which is price action, the problem with waiting for moving average crossovers is that price has long left the station before the crossover takes place and you enter late with poor RR.

But quite often price will retrace to an MA as it does to a trendline and added with other factors can give a good point of entry to get in with the established trend.

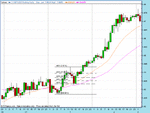
For example on the 1st of this month I was looking to enter long on cable on the hourly chart after price forming a pivotal point on the daily chart on the 31st march.

I got up late and if you note on the 9 am bar price had already moved up 100 pts from 6/7 am. Now I wasnt prepared to chase price and enter here, so resigned myself to being a frustrated long looking for a better RR entry.

I started paying attention when price started to retrace from the 12 pm bar, when the 2 pm bar closed, price now was in between the rising 20/50 ema zone.

This gave me added confidence to enter on the rising 3 pm bar because there was confluence with the 61.8% fib of the HI - LO range of the day.

So the only indicators I use on my charts are these 2 emas but only as added support and confirmation of horizontal S/R levels.

I personally wouldnt use the MA crossovers for reason given above.

Good trading.
 

Attachments

  • img_12390109828703.gif
    img_12390109828703.gif
    16 KB · Views: 180
Hi Minch, that does look like a nice entry 🙂

I agree about the lagging part. From Aaron's question and theBramble's answer, I wasn't actually thinking of it being a good trading entry signal, but wondering if it affects the subsequent price action. Perhaps people jump in prior to the crossover (if it looks like it will cross) or perhaps after a crossover, there may be some who stay in a trade longer because they have more confidence or whatever. Or there might be people who DO take the crossover as a valid trade entry, and then perhaps it affects things.

Yes I accept people trade off these signals.
But they will always be behind the curve.

" cause and effect "

Better become an expert at cause rather than effect.
 
Last edited:
Back
Top