[Note: all of this is in response to your first post.]
Well, first, firewalker, you shouldn't be trading with real money at all until you have this nailed. There is no virtue in learning by burning up your equity. If you have no trading plan that comes even close to being consistently profitable, then your entire approach is based on hope. And now fear. Therefore, your focus is shifting from learning how to trade price to learning how to avoid losing your money, and this is not the best place to be in order to develop as a trader.
You've asked some good questions and, for the most part, they are well within the scope of this thread. However, questions regarding strategy and tactics are more appropriate to a journal since they are specific to you and since they will likely be ongoing, and this thread is plenty long as it is
🙂
Therefore, I'm going to limit myself to principles here -- or try to -- even though that won't be nearly enough. If you truly want to master this, I suggest you open up a journal (
http://www.trade2win.com/boards/forumdisplay.php?f=164) so that we can get into where you should enter, where you should exit, what kind of stops you should use and where, and all the other details of whatever it is you decide to do in your particular situation.
I've looked at Lamont's comments and I concur with everything he says. Somewhere you got off track. But rather than review what's already been reviewed here and elsewhere ad nauseum in order to figure out exactly where you wandered off into the weeds, let's focus on your charts, one at a time. This is, in a way, a sneaky means of reviewing principles, but doing so through application, which is the only way many people can learn, and which is the reason why I've begun focusing on application -- such as with the S/R thread -- rather than get involved in yet more discussions on theory and philosophy which invariably turn out to be discussions of what has already been discussed over and over again.
So.
First, it's clear that you've put a great deal of time and thought into this, which is good. And encouraging. However, you refer several times to this stuff "working". Support, resistance, and price are not a method or a system. The analysis of all this is an investigation of how markets work, i.e., how traders trade. Once you understand the dynamics of how buyers and sellers interact with each other, it is then up to you to determine how best to take advantage of those interactions. In other words, there will be no flashing red arrows which say "enter here".
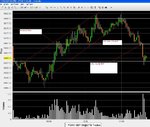
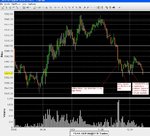
Second, it's always easier to see thru the window after one cleans the glass, so I've reduced your first chart to the basics, i.e., price and volume (though even volume is not necessary, as you will see, and may even be a distraction). Since this takes some doing, I'd appreciate it if you'd convert your charts to what I have below: no channels, no S/R (support/resistance) lines, no trendlines, no colors other than black and white.
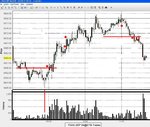
Now. For the sake of simplicity, let's assume that life begins at the left edge and not get into the backstory here (otherwise, we could be here all day). Note that price hits 5655 and recoils from it. It then drops below it to 5647.5, then rallies back to 5655 where it is halted. Ah Ha! Resistance? Probed once from the topside (twice if you count the drop through) and now from the bottom side. This should cause a Hmmm on your part, something to pay closer attention to. Price then waffles around (and when I say Price I mean buyers and sellers) for a few bars, probes 5655 again, then falls. However, when it drops below the last swing low (LSL) at 5647.5, it rallies back in the same bar to close well off its low (if you were to look at a tick chart of this, you would see the wave of the dynamics of the exchange between buying pressure and selling pressure rather than a "bar", which would enable you to understand candlestick voodoo much easier and avoid assigning quite so much "meaning" to candlesticks and candlestick patterns). It's the closing well off the low that matters, not the color of the bar since buying pressure had to exceed selling pressure in order for this to occur. The volume bar tells you how much trading activity accompanied this movement. But what matters is the movement of price since that's where you make or lose your money.
But this particular test is not yet over. Sellers push price down again, and this time the trading activity increases. But what happens? Going back to what Wyckoff describes as effort and result, traders put more effort into this movement (more trading activity, i.e., higher volume) but the result is that price not only rebounds above the low of the previous bar (or the previous swing low if you're looking at a tick chart), but it also rebounds above the
close of the previous bar, creating a potential shakeout (you mention my pdfs; the description of the shakeout is in Demand/Supply, so I won't go into that again here).
The proof, however, is as they say in the pudding. Look what happens to price now. It rallies all the way back to R (resistance) rather than plunge lower, suggesting that what looks like a shakeout really is a shakeout. It then breaks above R. Do you take this or not? And here's one example of where trader-specific strategies and tactics depart from "principles". There is no inherent good in taking or not taking this BO (breakout). You can determine in part whether or not to take it by developing and testing a trading system (or method or strategy or whatever you want to call it) which incorporates trading BOs. If that system as you've designed it is consistently profitable, then by all means take the BO. If it isn't, don't.
But whether you take the BO or not, traders again waffle around here, and while the waffling can be frustrating and even prompt you to exit, the waffling does confirm the importance of this level or zone (if it weren't important, price would breeze right through it). There is yet another quick downdraft, and this time on heavy volume, i.e., substantially increased trading activity, the highest so far. Lots of effort here. And what is the result? Again, price closes well off the lows, i.e., both buying pressure and selling pressure increase (more trading activity), but buying pressure wins the day. What matters, in other words, is not so much how far price travelled downward, but where it ended up. This tells you who -- for the moment at least -- is in the driver's seat. And if you have not yet bought the BO, you'd have a bit more confidence in doing so now.
If you don't, you can wait for the retracement (RET), which is where I've placed the second red dot. RETs disturb many novice traders because they think they screwed up. They want to reach their target as quickly as possible. If they don't, they think they're in trouble. So they cut their profits short. But rather than descend into flop sweat fear, focus on what a RET represents to those who didn't buy the BO. This is their second chance. And if they take it, you may be in for a nice, profitable ride (if they don't, you perhaps have -- and reasonably so -- a stop at BE by now and aren't especially concerned about it one way or the other). If you're one of the people who waited, you can enter now. However, this is next best to taking the BO since your risk is higher. You entered "late", placing you in the ranks of "weak hands" (i.e., the first to bail when the going gets rough because they have no cushion or buffer). If you wait even longer for further confirmation and buy (the third dot) when price BOs past the last swing high (LSH), your risk is higher still, and you'd be in the red almost immediately, though ultimately, if you insisted on hanging in no matter what the risk, you might make a few bucks, or at least BE.
By now, you have a higher high (HrH) and a higher low (HrL). The third dot represents the next HrH. Therefore, until you fail to make a HrH, you are in an uptrend. Shorts are not an option. In fact, depending on your particular strategy, shorts may not be an option even if you have a LrH if the LSL is still intact (more on this later). Price continues its ascent, finally retracing its progress to find S (support) at the previous swing high at 5667.5 or thereabouts. Entering here would be ultra-conservative given all the confirmation but it would also be near-suicidal. The weakest hands would enter even higher still, at the new high, which is where panic sell-offs are conceived. It then rallies yet again, making what is in hindsight "the high".
But what now? You're trading in real time. Hindsight is a luxury you don't have (and note that I've said nothing about volume so far exc with regard to the shakeout because it's not esp relevant or even helpful). What does price do? It retraces. But how far does it retrace? Does it drop below the LSH at 5677.5? Hmmm. Seems a bit weak, doesn't it? But you're up almost 40pts, so a little rest is in order, not unusual. Perhaps price will consolidate here for a while and buyers will prep themselves for a push to a further advance.
And, apparently, they do. But when price reaches the previous high, it runs into trouble (if you're waiting until now to go long, I can't help you
🙂). It appears to form a double top (or a LrH if you're using candles and pay more attention to the bodies than to the wicks). Here again volume can be helpful to you since the trading activity here is FAR less than it is on the previous high, suggesting a lot less buying interest (not so much because of the amount of trading activity per se but because price isn't rising). Thus, if you were to SAR here (stop and reverse), you'd lock in the profits on your long and be at near the best possible position for your short (near best because your stop could be so near). This last, however, gets into strategy and tactics and is best left to your journal, if you choose to pursue this.
If shorting there is too aggressive for you, you can wait until your trendline is broken (not drawn in here, but I hope it's obvious) and the reversal confirmed, i.e., a drop below the LSL, which is where I've drawn the lateral red line at about 5671. Note that it is on the way down to this line that the trading activity increases. The importance of this line is confirmed by the extreme dryup of trading activity just before price breaks thru this line and the teeny-tiny bars that are the result of that activity. Then donk!, at which point you might want to enter your short, even though the stop must be much farther away and your risk much higher.
Again, you can wait for the RET, though this one repenetrates -- temporarily -- the S/R line (the last red dot). This is safer and represents somewhat less risk, not so much because of the price entered but because of the confirmation of weakness and because of the possibility of a tighter stop. But there clearly is weakness here along with a confirmed reversal. There is no long here, only shorts. (If somehow buyers manage to pull it together and reverse the reversal and make yet another attempt at a higher high, you at least are out with a profit on your long and perhaps a tiny loss on your short. And it happens. But that's the difference between trading in hindsight and trading in real time.)
Then, of course, WHAM! The weak hands cry Uncle and you've plunged 25pts.
As for predicting, don't even bother. Even if the attempt weren't so difficult for the novice (and often the not-so-novice) and didn't take so much time, it wouldn't matter. If and when you thoroughly understand what's happening in front of you, you'll know what to do, or at least what is likely to be the most appropriate course of action. If you allow yourself to sink into the muck of the minutiae of what each itty-bitty bar "means" and how it "relates" to every other itty-bitty bar, the trade will be long gone before you ever decide what it is you should do. Focus instead on the setup, on the conditions for the trade. This is where principles will guide you. But you must then decide exactly what it is that you're going to do if and when the conditions are right. Predicting what will or won't or might or might not or should or shouldn't happen after the trade is entered is wasted brain time. Knowing what you will do if and when certain events happen is part of your tactics and has been planned out long before.
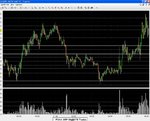
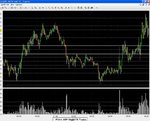
But this is long enough now. If you have no questions, do you want to take a shot at your next chart? Or do you want me to do it? Either way, I'd appreciate your reposting it as I requested: no lines, no colors other than black and white, preferably no candles.
Db

