ljyoung said:
Db,
I am following up on your kind offer of last night:
Therefore, if you're interested in my views on distribution and topping mechanisms -- with or without volume -- bring it down to the application level and provide me with some chart examples.
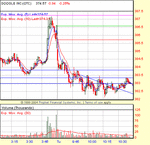
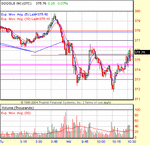
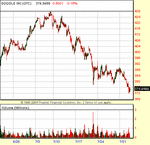
and ask for any thoughts you may have on these 3 GOOG shots.
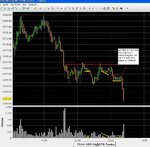
The lines in the 2 intraday charts represent:
Blue - old daily highs or lows
Red - most recent daily high or low
Black - most recent close and the open for the day
Green - close 2 days ago
Pink - a gap edge
The 2 ID charts have various combinations of these lines and please ignore the "angled" blue lines. The third chart is a naked P/V chart to provide context for the intradays.
TIA for your time.
I seriously doubt that what I have to say is what you're looking for, but I don't want to ignore you, either.
First, way too many lines. You're dazzled by the trees. Let's look instead at the forest.
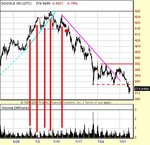
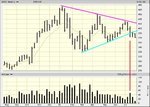
Note how the trading activity (wish I could abbreviate this as TA) increases when a new high is made at the end of June. Fine.
Now note how low the trdng act is at the next new high. Where are the sellers? Was all of that activity during the previous high the beginning of distribution? Not necessarily. Price can continue for longer than you'd believe on very little trdng act at all. When it gets to the point where sellers' interest is renewed, they'll jump in. Until then, price will rise as long as somebody is willing to pay the ask.
Now you get a big clunk that settles at the last swing high. The fact that it doesn't drop farther is good. However, note that the trdng act on the next push is no better than it was during that clunk. Not only that, but price can't make any further progress. In fact, it consolidates at that last swing high. Further distribution?
Now look at the trdng act on the next push. Pitiful. A reason to exit? Up to you. You may want to wait for the reversal, if there is one. But at least you have a couple of important lines in the sand: the demand line and the last swing low. If price violates both, it's time to lighten up or get out.
Price does not, however, violate both. Instead it finds S at the last swing low (the blue line). It does violate the LSL on the next attempt, but quickly shoots back up above that line, confirming its importance, if not its strength. And if you exited, you may feel like a chump.
But rather than beat yourself up or jump back in impulsively, watch what happens when a new high is attempted. Trdng act is not remarkable, no higher than it was on the way down. And there is no new high. That makes the red dot your short entry. Or one of them. Again, this depends on your strategy and tactics.
Then you fall fall fall to 78, at which point you rally. This gives you tentative support (there are others along the way, but I'm trying to cut to the chase). This is tested again without violating the supply line. When the supply line IS violated, the last swing high is not exceeded, or even reached. Therefore, when you break 78, you still have your downtrend intact and a more important S/R level to look at.
THEREFORE (finally), whatever you do intraday is rooted in what happened at 78. If you didn't short at 78 or soon thereafter, then you are more likely to be pulled and pushed and banged around. Even 78, of course, is far too late, but maybe you weren't trading GOOG when it topped out.
As far as distribution goes, however, all that is history. From that point forward, it becomes a matter of S/R and "trend", if that's what your strategy is based on (if your strategy is based on something else, then S/R and trend may not matter). If Tuesday is the day it dropped below 78, then you have to decide how tight your stop is going to be, what your target is going to be, whether you're going to scale in or out or both and how. But "distribution" is not going to be of much help to you. And volume may not be of much help either, if any.
Db

