firewalker99
Legendary member
- Messages
- 6,655
- Likes
- 613
firewalker99 said:First of all I'd like to thank you for your time making this a very thoroughly and detailed answer. I appreciate the time and effort you put in these to answer it.
I'll try and adjust my charts for future reference in b/w.
Apart from that, I must say your "step-by-step" guide following this chart is very interesting for me. I'll get back to you later about your reply, but study it some more first. Before I try it myself, I'd ask you to review my last chart, if you could analyse and comment on that one, I think it could clear up my head a bit. Next week I will be papertrading as I believe my losses have amounted too much and I'm trying not to be emotional about it - but it's not that easy. Now the only target for me is to get a clear understanding of it and put my theories back to the test although I must note that I've had several profitable days always. Albeit you might argue this was just luck, I hope all my time and effort waren't in vain and I'm going totally the wrong way. If so, please let me know, otherwise I'm looking forward to your comments.
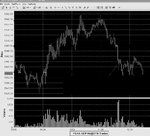
dbphoenix said:A quickie here,
Then, when buyers finally yield and allow price to find equilibrium, or try to, it spends no time at all at the next low but immediately tests yet again that S/R zone. The fact that it breaks back into it is as strong a signal of serious buying interest as you're going to get in this world (if the buying interest weren't there, price wouldn't have risen). Not that I would go long here, but, if I did, I could have a hell of a tight stop.
Db
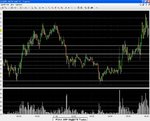
firewalker99 said:I'm unable to login to IB now, so I had to manually change my chart to look b/w.
Hope this is ok (for now).
firewalker99 said:Exactly what I was thinking, I saw a couple of strong signals that made me place an entry. I was stopped out at breakeven because it only went up a couple of bars... But after that (I included the day chart sorry for the colors) you see it makes a new low for the day after that! It actually goes back lower than the point at the opening... You say you wouldn't go long there, I guess that's were the difference is in a pro and me 🙂 I have and was stopped out... But am I wrong thinking this could have been a great entry point and chances were that price rallied up?
dbphoenix said:I just read this after having posted my review of your last chart, so maybe we're in tune at some level or other.
As for the papertrading, I suggest you take a breather. For one thing, you are not in a particular productive place emotionally. If you papertrade here, you are likely hoping that the market will make you feel better. But the market has no idea who you are and couldn't care less about you. It just is. Like smallpox. For another thing, since you do not yet have a completely-though-out strategy, much less a consistently profitable one, you would most likely be papertrading what you think and/or feel rather than papertrading your trading plan, and while you might get lucky for a while, that isn't going to get you very far.
I'll say here that you are the first person I've encountered in quite a long while who's put as much thought and effort into price and volume and trading by price, which is the main reason I've taken so much time with this. And I don't yet know just how tangled up you are. But you have the desire and you appear to have the willingness to do the work, so another shot is in order. And if you continue to have difficulties, there are other ways of trading which may be easier on your stomach and your pocketbook.
So take the time. Breath deeply. Relax. Take a long walk. Clear the cobwebs. If you haven't read this thread yet, it's a good start. I suggest you also read the threads below my name, especially on trading plans and journals. And I encourage you again to open up a journal here since this gives you an ongoing record of your progress, with charts, and provides me and others someplace to make comments on your specific situation. You might also find FXCowboy's journal to be of interest since he is interested in much the same things you are.
Db
dbphoenix said:Actually, I had black on white in mind rather than white on black, mostly because black on white facilitates printing. Black on white uses a lot less ink, and there are going to be times when you'd prefer to get away from your computer and curl up with your charts and a pencil someplace else. And there are going to be people reading this stuff who want to print out your charts and study them themselves (as scary as it may seem, there are people who've kept notebooks of my stuff since 1997, which is when I first went online).
But you know what you want better than anyone else. If you prefer white on black, so be it.
Db
dbphoenix said:By "next low" I meant 1330. However, getting into where to enter and where to place the stop and so on gets into specifics that are best relegated to a journal. Otherwise, this thread could top 1000 posts in no time at all.
Opening up a journal does not mean that people can't read it or post comments to it. But it does enable those who are interested to follow what you're doing it without having to skip around within a general thread like this one or to jump from thread to thread. A journal, in other words, provides continuity.
Let me know what you want to do. I can also respond via PM.
Db
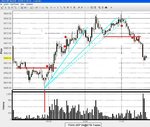
dbphoenix said:If shorting there is too aggressive for you, you can wait until your trendline is broken (not drawn in here, but I hope it's obvious)
Db
firewalker99 said:What exactly do you mean by "there are other ways of trading which may be easier on your stomach and your pocketbook"?
firewalker99 said:I'll check out some other journals first, get an idea how far in depth you go.
Don't want to post it if others don't find it relevant or interesting enough to comment on...
dbphoenix said:Here's the chart with the demand lines/trend lines in case they're not so obvious after all.
firewalker99 said:Well I thought it was logical to connect to lowest points (your most upper blue line), but I connect the higher high's also. Not to say I'm looking for a parallel line, because I'm not, but these are imo points where the price changed direction quite obviously...
dbphoenix said:I didn't know that a "high volume print [was] so frequently associated with supply". A "high volume print" is associated with "high" trading activity, i.e., transactions, which, in order to be transactions, must include both something bought and something sold.
But I'm sure you had something more specific in mind. Feel free to post examples.
Db
ljyoung said:TW (Tom Williams) states that one should always be alert to the possibility of supply when one sees a high volume print (a bar, candle, ... associated with a high volume relative to the volume level that had recently been observed). I take this to mean that when this occurs in an uptrending market, someone may not be buying in but rather selling out. If this is the case then the selling may be a harbinger of more selling. Clearly this happens at a top.
If the MM's are marking up the price after accumulating a wad of stock at a much lower price and have satisfied them selves that there is no appreciable float (otherwise they wouldn't be marking the stock up) then how does one make the judgment that the increase in activity is the expected consequence of small players buying the stock as it moves up in price as opposed to the stock moving up in price because the MM's are marking it up. Is it that the volume associated with the small players is so "small" that it doesn't really make a large addition to the overall volume which is present in a given time frame?
If this is so then what TW says makes sense because when an impressive (large) amount of volume appears on the scene it most assuredly is going to be associated with a larger player who indeed may be selling.
Volume measures are relative things and so there is some level at which volume moves from small to medium to large and this will depend on any number of factors, but again TW says look at the recent intensity to get a feel for this (I understand that some people use volume + 1,2,3 S.D. to try and quantify the amounts).
Which brings me back to what I was trying to say in the earlier post. Is the supply concept strictly related to the selling of marked up stock by small investors occurring when the MM's, in response to what the big players want to do, start marking the stock down (do they mark it down by selling to the bid, i.e., going short?) after they have distributed as much as they can at the topping price to the small investor or is it a combination of, if you will some amount of "sloppy" distribution by the MM's followed by increasingly panicky selling by the small investor (or trader for that matter - speaking from personal past experience) and further short selling (by whomever)?
If the latter is the case, then after the tumultuous ride down, the smart money decides "OK this is a good place to stop" and after checking for the absence of any further supply, start the whole thing over again. The demand aspect really is manifest then as a slow accumulation by the smart money and they do it in such a measured (?small volume) way so as not to drive the price up. If too much volume comes in (again a relative thing) they (the smart money) know it ain't time to move up price and will drive the price back down (?by shorting).
If I knew more exactly what was going on I would not be so windy. It (the market) is to say the least rather complicated, but its workings should be amenable to solution by the application of rational principles of thought based on what we see and influenced by the fact that the smart money with their big accounts and inside info will make every effort to confuse those outside the inner circle.
Hopefully this is a little clearer ,although after reading through it - perhaps it isn't.
TIA
Larry
Porks said:Db,
Realistically, how long do you think it would take a beginner to go through the steps you suggest to study the principals, tactics, and develop/test a trading plan and aquire the correct mindset.
I know this'll be variable, but from your experience what's the least amount of time someone has picked all this up in ?
It's been said before that it takes 1,000 hours to learn something, maybe 5,000-10,000 to master it.
The reason I ask is because TW often says when analysing the market 'its so obvious to me, its shouting at you, why some people have a problem seeing or picking this stuff up I don't know'
But then he did spend many years in a trading syndicate, by all accounts.
What do you think, could a complete novice pick this up in 6 months spending around 8 hours a day ???
Porks