counter_violent
Legendary member
- Messages
- 12,672
- Likes
- 3,787
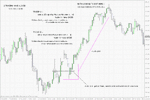
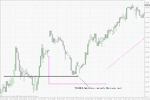
What timeframe do you think the chart below is? And if you went long at the green dot or short at the red dot (for example), how tight could your stop be if you would place it below or above the last swing?
This is very telling
Using a tick chart as the basis of your trading...no wonder all your time is spent staring at screens until your eyes bleed...additionally...this type of trading is a very crude way of top or bottom fishing....with I might add...a lot of stop outs along the way...small stop out yes...but lots of them.
I have better things to do with my trading screen time.

