Perfect Wave - 2012-1/2

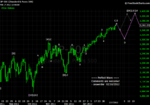
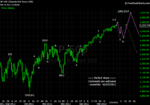
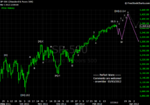
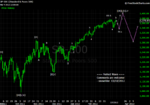
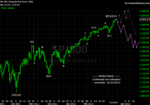
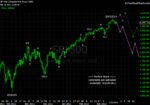
1) if SPX goes to 1370 first before C5 formed, the C5 will equal C3, or may be great than C3, right ? but we know C5 can't be great than C3 according Wave Theory. How can we explain this?

C.3 = 84 (1333-1249)
C.5 could be: 1300+84=1384 if C.3=C.5
C.5 could be longer than C.3 (as long as C.3 is not the shortest was in C)

2) If C5 is really formed at 1370, the Fib 61.5% pull back target should be great than 50 point, right ?

If C.5 ends at around 1384, the ideal correction target for C is where the previous 4 ends (C.4, i.e., 1300 area)

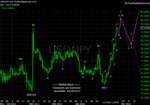
3) how can we draw the a-b-c waves after C5 (It's not indicated in the chart ??) I mean wave 'b' is great than C5 <-- Does it mean 'extend' wave instead of a-b-c waves (purple lines) ?

The ending of C.5 is the ending of wave-C. After that a wave-D could be formed. We don't know if wave-D will be in regular or irregular correction form until we see the market's behavior.
 
I'm a big fan of Elliot wave theory and harmonic trading, however you way over complicate the labeling which deters me (and probably others) from following along. Simply stating the pair and TF (in post) with wave counts 1,2,3,4 a,b,c,d and sub waves as 1a, 1b, 1c, 1d ect works just fine. This, of course, is just my opinion, in the whole scheme of things, it doesn't make much difference.

Big ups for the thread though not many people keep up with these sort of threads. So even if you don't conform to my way of thinking do keep posting charts others will surely find it helpful or at the vary least interesting.

johnny2pips - Thanks for commenting and the suggestion. Please take a look the very first post of this thread, and it will give us an idea about the convention of my wave labeling. It is actually much easier to read and much less confusing than that of most famous EW techinicians. Yes, I agree that "it doesn't make much difference" on different labeling ways because we EW techinicians speak the same language - impulsive vs corrective waves.
 
02/18/2012

Comments are welcome!
 

Attachments

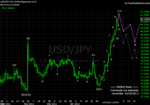
  • 20120218 SP - Daily.png
    20120218 SP - Daily.png
    44.1 KB · Views: 1,433
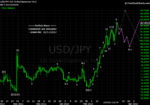
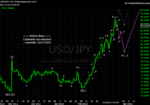
  • 20120218 JPY - Daily.png
    20120218 JPY - Daily.png
    49.6 KB · Views: 1,342
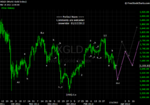
  • 20120218 Gold - Daily.png
    20120218 Gold - Daily.png
    46.8 KB · Views: 2,348
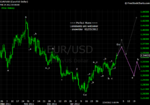
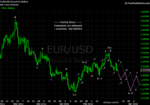
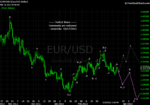
  • 20120218 EUR - Daily.png
    20120218 EUR - Daily.png
    42.8 KB · Views: 1,307
Rothschild - I would guess that SP spot index 1320 area could be where the reversal starts. We need to pay attention if SP ever moves to that area to see if there is any sign of exhaustion.


Hows about an update ?
 
Hows about an update ?

Pat - So you see that 1320 did not show any sign of climax or exhaustion ... and I have been updating the wave count every weekend. Now here is just my guess that a big correction is going to start this week.
 
Pat - So you see that 1320 did not show any sign of climax or exhaustion ... and I have been updating the wave count every weekend. Now here is just my guess that a big correction is going to start this week.

I have been expecting a correction for weeks - what with the Euro wobbling and Greece allowed to drop into a bottomless pit, but it is yet to happen.
 
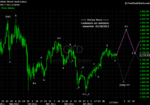
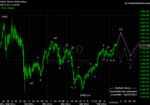
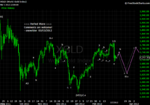
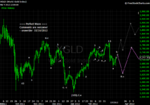
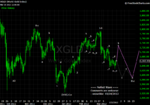
for gold, you're saying we're in a triangle, with the E wave having started lower. However, the triangle connecting ABCDE you show is neither descending, ascending, or symmetrical. Am I missing something?

nim1984 - Thanks for commenting. The wave-E scenario was based on the assumption that wave-D must be in a 3-segment movement. Today's price action shows that the purple line scenario is more possible because our previous wave-D has become a 5-segment wave which means that it is not a wave-D any longer. Talking about a triangle, it does not need to be perfectly descending, ascending, nor symmetrical, as long as it is a triangle. Hope this help.

130054d1329627559-perfect-wave-2012-1-2-20120218-gold-daily.png


129668d1329076971-perfect-wave-2012-1-2-20120212-gold-daily.png
 
02/25/2012

Comments are welcome!
 

Attachments

  • 20120225 SP - Daily.png
    20120225 SP - Daily.png
    46.3 KB · Views: 1,382
  • 20120225 JPY - Daily.png
    20120225 JPY - Daily.png
    51.7 KB · Views: 1,397
  • 20120225 EUR - Daily.png
    20120225 EUR - Daily.png
    44.3 KB · Views: 1,405
  • 20120225 Gold - Daily.png
    20120225 Gold - Daily.png
    46.6 KB · Views: 1,360
Last edited:
03/03/2012

Comments are welcome!
 

Attachments

  • 20120303 SP - Daily.png
    20120303 SP - Daily.png
    47.2 KB · Views: 1,210
  • 20120303 JPY - Daily.png
    20120303 JPY - Daily.png
    53.7 KB · Views: 1,182
  • 20120303 Gold - Daily.png
    20120303 Gold - Daily.png
    46.9 KB · Views: 1,151
  • 20120303 EUR - Daily.png
    20120303 EUR - Daily.png
    43.8 KB · Views: 1,135
03/11/2012

Comments are welcome!
 

Attachments

  • 20120310 EUR - Daily.png
    20120310 EUR - Daily.png
    44.2 KB · Views: 1,007
  • 20120310 Gold - Daily.png
    20120310 Gold - Daily.png
    47.9 KB · Views: 1,228
  • 20120310 JPY - Daily.png
    20120310 JPY - Daily.png
    53.4 KB · Views: 1,033
  • 20120310 SP - Daily.png
    20120310 SP - Daily.png
    44 KB · Views: 1,112
Quote from jas_in_hbca:

bot a few apr 505 puts on aapl @ 2.88

looking for 540 to exit some

nice count . hopefully this 5th wave doesnt extend.

looks like a possible exhaustion gap yesterday on hi vol too

jas_in_hbca - Thanks! Yes some people are saying that the release day of iPad3 is the reversal day of AAPL. Now the wave count for SP is taking the grey line scenario, which it has almost finished the 5-5-5 ... wave. I am thinking that either tomorrow or next Wednesday the key reversal could occur.
 
Well done on SP 1400. I do not expect it to hold for now either, but do you really believe it will drop below 1300? Not saying I don't think it will or not, just curious about your opinion.

4ex - Thanks for commenting. As you know that my prediction is all based on EW theory, sometimes people don't believe something would happen and I don't believe either. If the current wave is really wave-[]-[C]-V-5 (most likely ending today or maybe next wednesday with extension), then next leg could go all the way down to 1280 area. Let's see how the market acts. :)
 
03/17/2012

Comments are welcome!
 

Attachments

  • 20120317 EUR - Daily.png
    20120317 EUR - Daily.png
    44.9 KB · Views: 1,328
  • 20120317 Gold - Daily.png
    20120317 Gold - Daily.png
    46.4 KB · Views: 1,135
  • 20120317 JPY - Daily.png
    20120317 JPY - Daily.png
    50.5 KB · Views: 1,164
  • 20120317 SP - Daily.png
    20120317 SP - Daily.png
    46.8 KB · Views: 1,289
Opinion is that we are due somewhat of a correction in the SP500.

Nice work Snowrider! SP500 will close the week under the 1400 mark and reinforces the downwards trend.
 
Opinion is that we are due somewhat of a correction in the SP500.

Nice work Snowrider! SP500 will close the week under the 1400 mark and reinforces the downwards trend.

Thank you Michael. I am hoping that SP does not make any extension from here; otherwise, the extension could go to 1440. Let's wait and see. :)
 
Quote from MADASINHATTER:

Yeah i got one.Why do you call it perfect? Do you mean in hindsight? Or is it part of the new world order where you take a word or phrase and use it to describe the complete opposite? Like saying " bringing peace and stability" while dropping bombs on people.Is it perfect in that sense? Where you show that it could go either up or down,on a scale of 1-10 how useful and perfect is that,say compared to just guessing?

MADASINHATTER - I call it Perfect Wave because it is the brand of the series of my wave posts. I could have called it Snowrider's Wave Analysis (but that did not sound powerful). Of course, you can interpet the word "perfect" as anything as you want. The analysis is of some educated guess. Isn't the whole world making guesses all the time? The analysis is based on the Elliott Wave Principle. If you don't know what that is, I would recommend you getting a book and study first.
 
03/24/2012

Comments are welcome!
 

Attachments

  • 20120324 SP - Daily.png
    20120324 SP - Daily.png
    46.5 KB · Views: 2,076
  • 20120324 JPY - Daily.png
    20120324 JPY - Daily.png
    50 KB · Views: 1,040
  • 20120324 Gold - Daily.png
    20120324 Gold - Daily.png
    44.4 KB · Views: 1,033
  • 20120324 EUR - Daily.png
    20120324 EUR - Daily.png
    45.3 KB · Views: 1,028
Quote from bwolinsky:

What has your backtest showed and what have your results been?

It's apparent some logic's went into the chart drawings, but none placed on any performance summaries or analysis of the data.

Reminds me of Hershyites, must draw straight lines, without questioning whether they actually did go to where they ended when they were drawn or any regard to what actually happened later.

This thread is missing that analysis, and it's required if you expect anyone to really analyze the charts that have been posted.

bwolinsky - I have extensively played system long time ago, I wrote tons of systems with TradeStation, I did backtesting 24x7, and then I threw all my systems to trash can. What I want to tell you about backtest is ... been there and done that. If you are asking some trader who utilizes price action and/or pattern methodologies (e.g., Gann, Elliott Wave, Dow Theory etc.) about back testing, you ask a wrong question!

I post my wave analysis here not looking for followers. I am looking for people who speak the same langauage (are also playing EW) for discussion. I am looking for people who enjoy playing EW on trading like playing chess. If you don't believe in EW, you won't be interested in reading my posts.
 
Hi snowrider some great posts on EW well done, some interesting points mapped out in the S&P.... I just have a question... is there any distinction on grey/purple trend lines? i.e one more probable than the other
 
Hi snowrider some great posts on EW well done, some interesting points mapped out in the S&P.... I just have a question... is there any distinction on grey/purple trend lines? i.e one more probable than the other

BoyTrader - Thanks for nice words. The purple lines are my preferred wave counts, while the grey ones are the alternative counts. Of course there are numerous possible wave counts out there, and different people have different preferred counts. I trade to the direction of the purple line. Once the market reaches some point where the purple line becomes invalid, the grey line takes over and becomes the preferred one.
 
Top